
The Sales by Order Type report answers a single question: how is your revenue split between cash-register sales and online channels? It buckets every paid order in the date range by where it originated — In-Store, Online Pickup, or Online Delivery — and shows totals, average ticket, and order counts for each, with period-over-period change indicators.
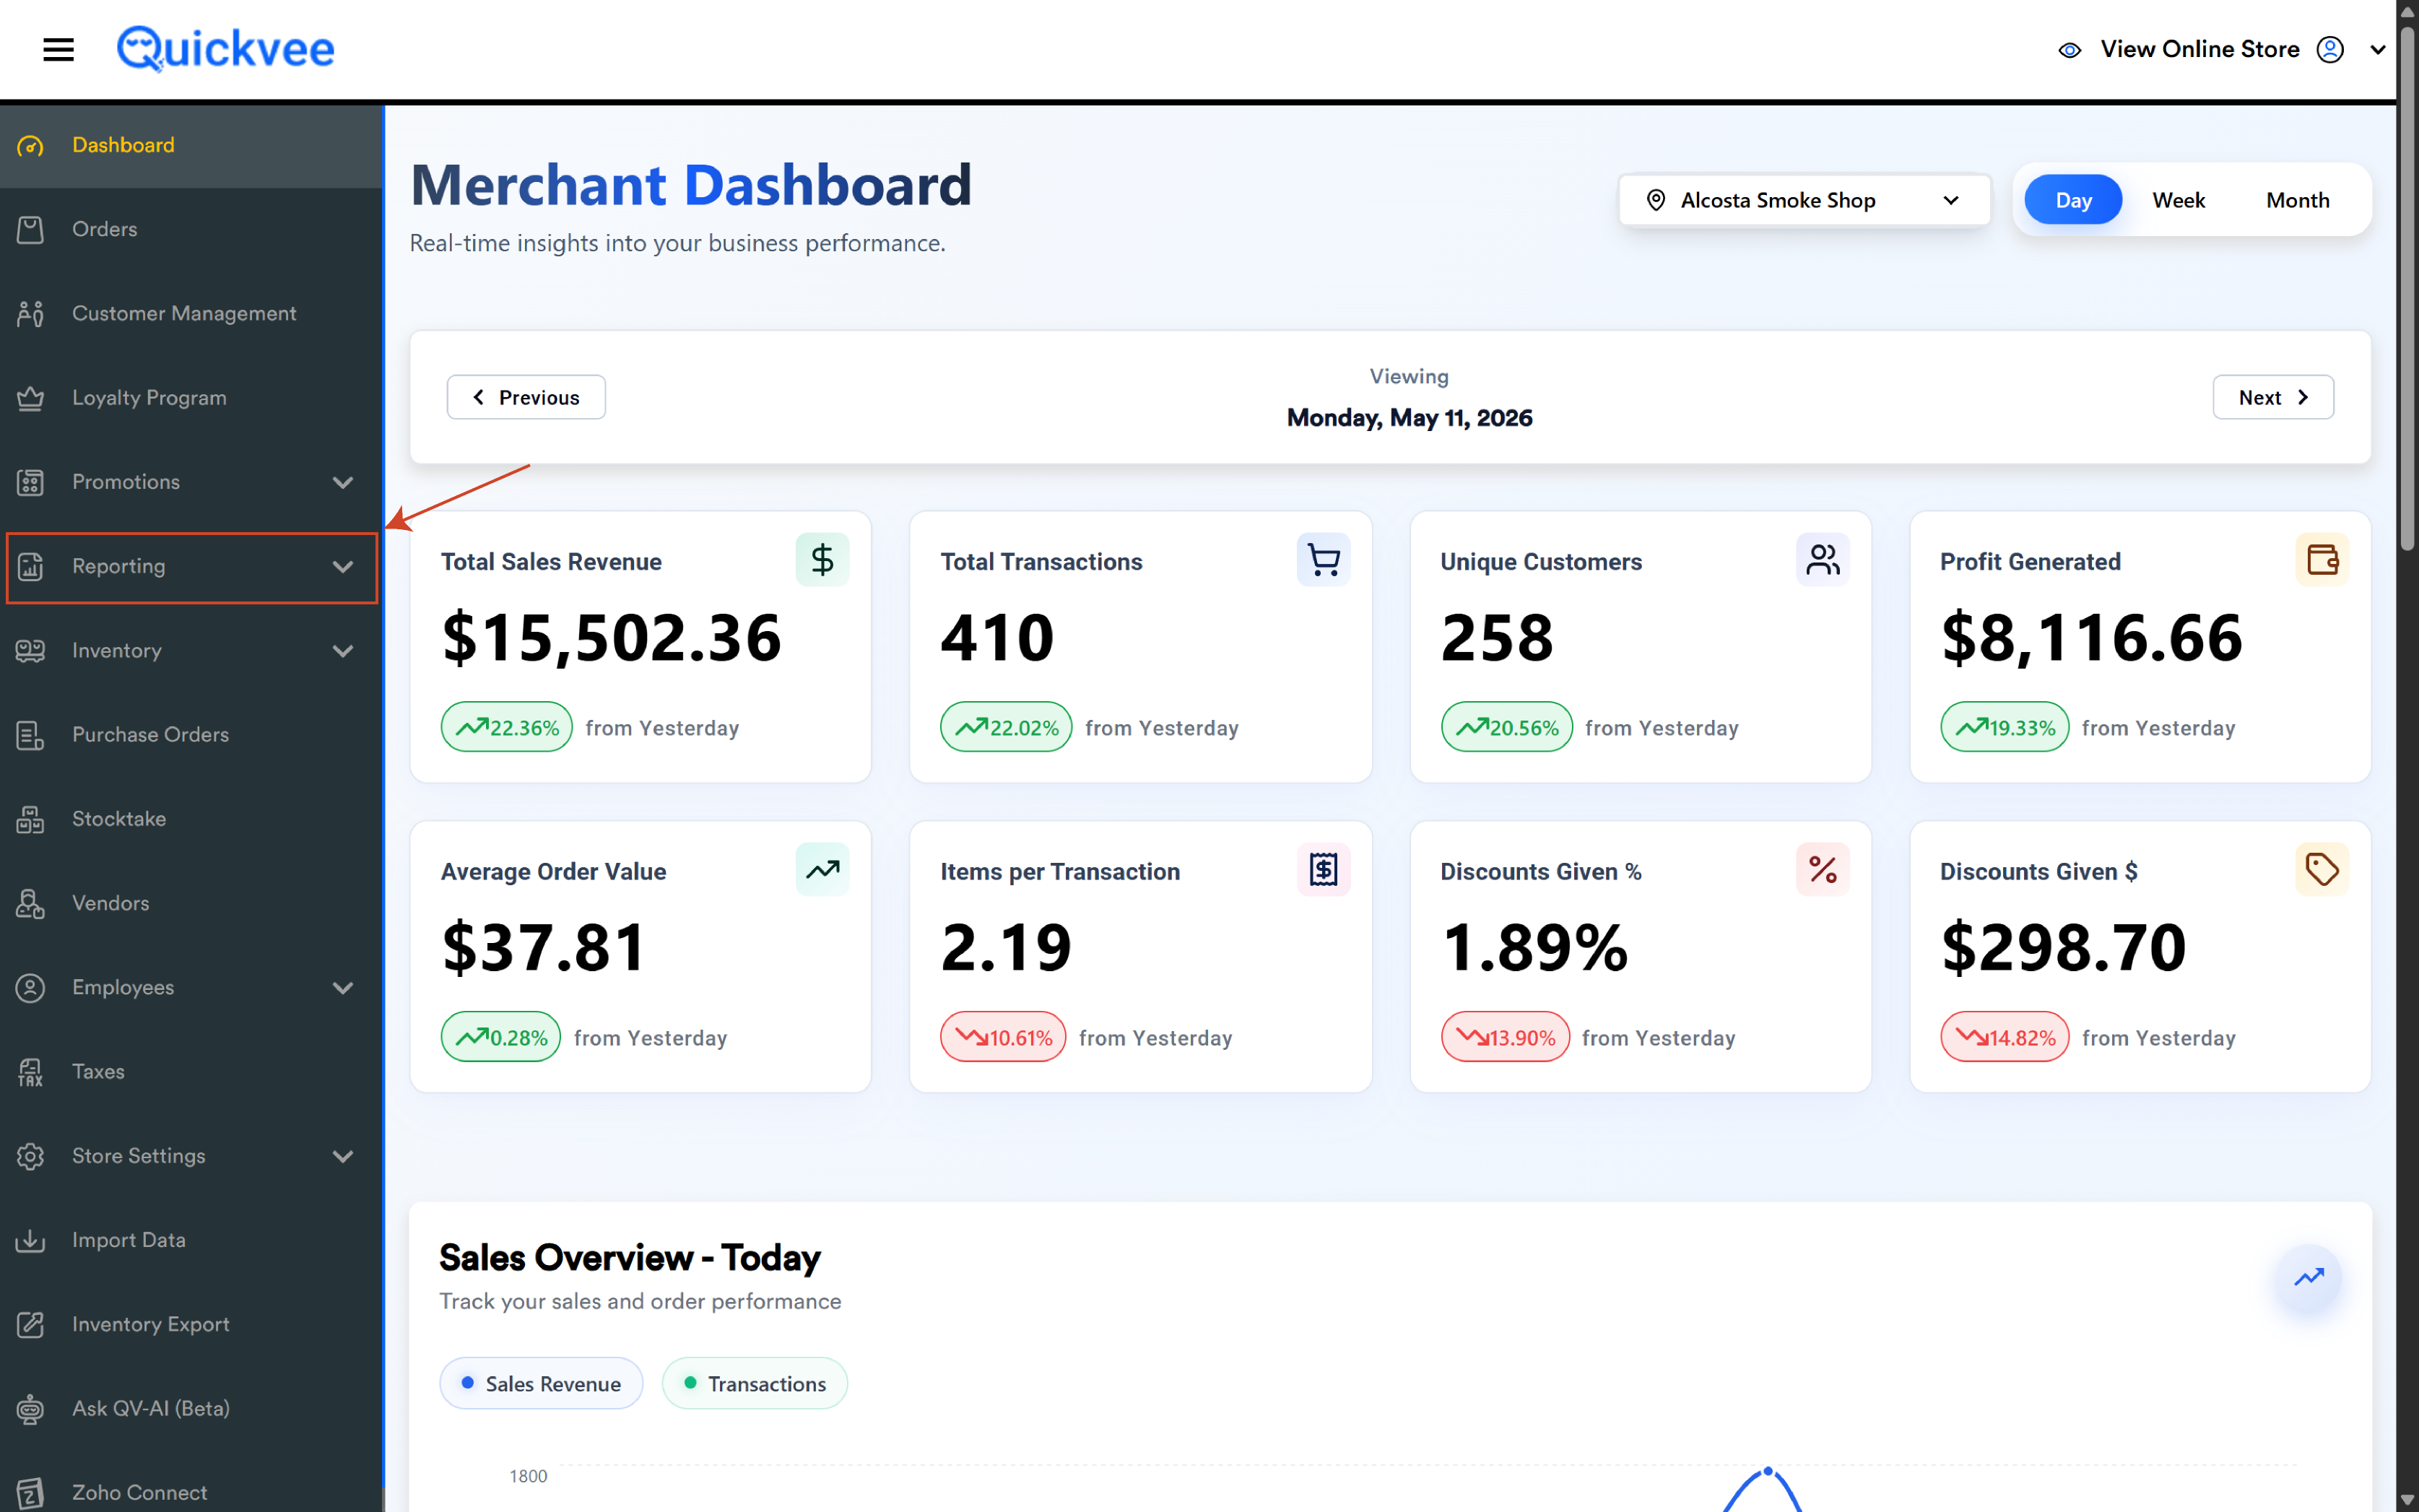
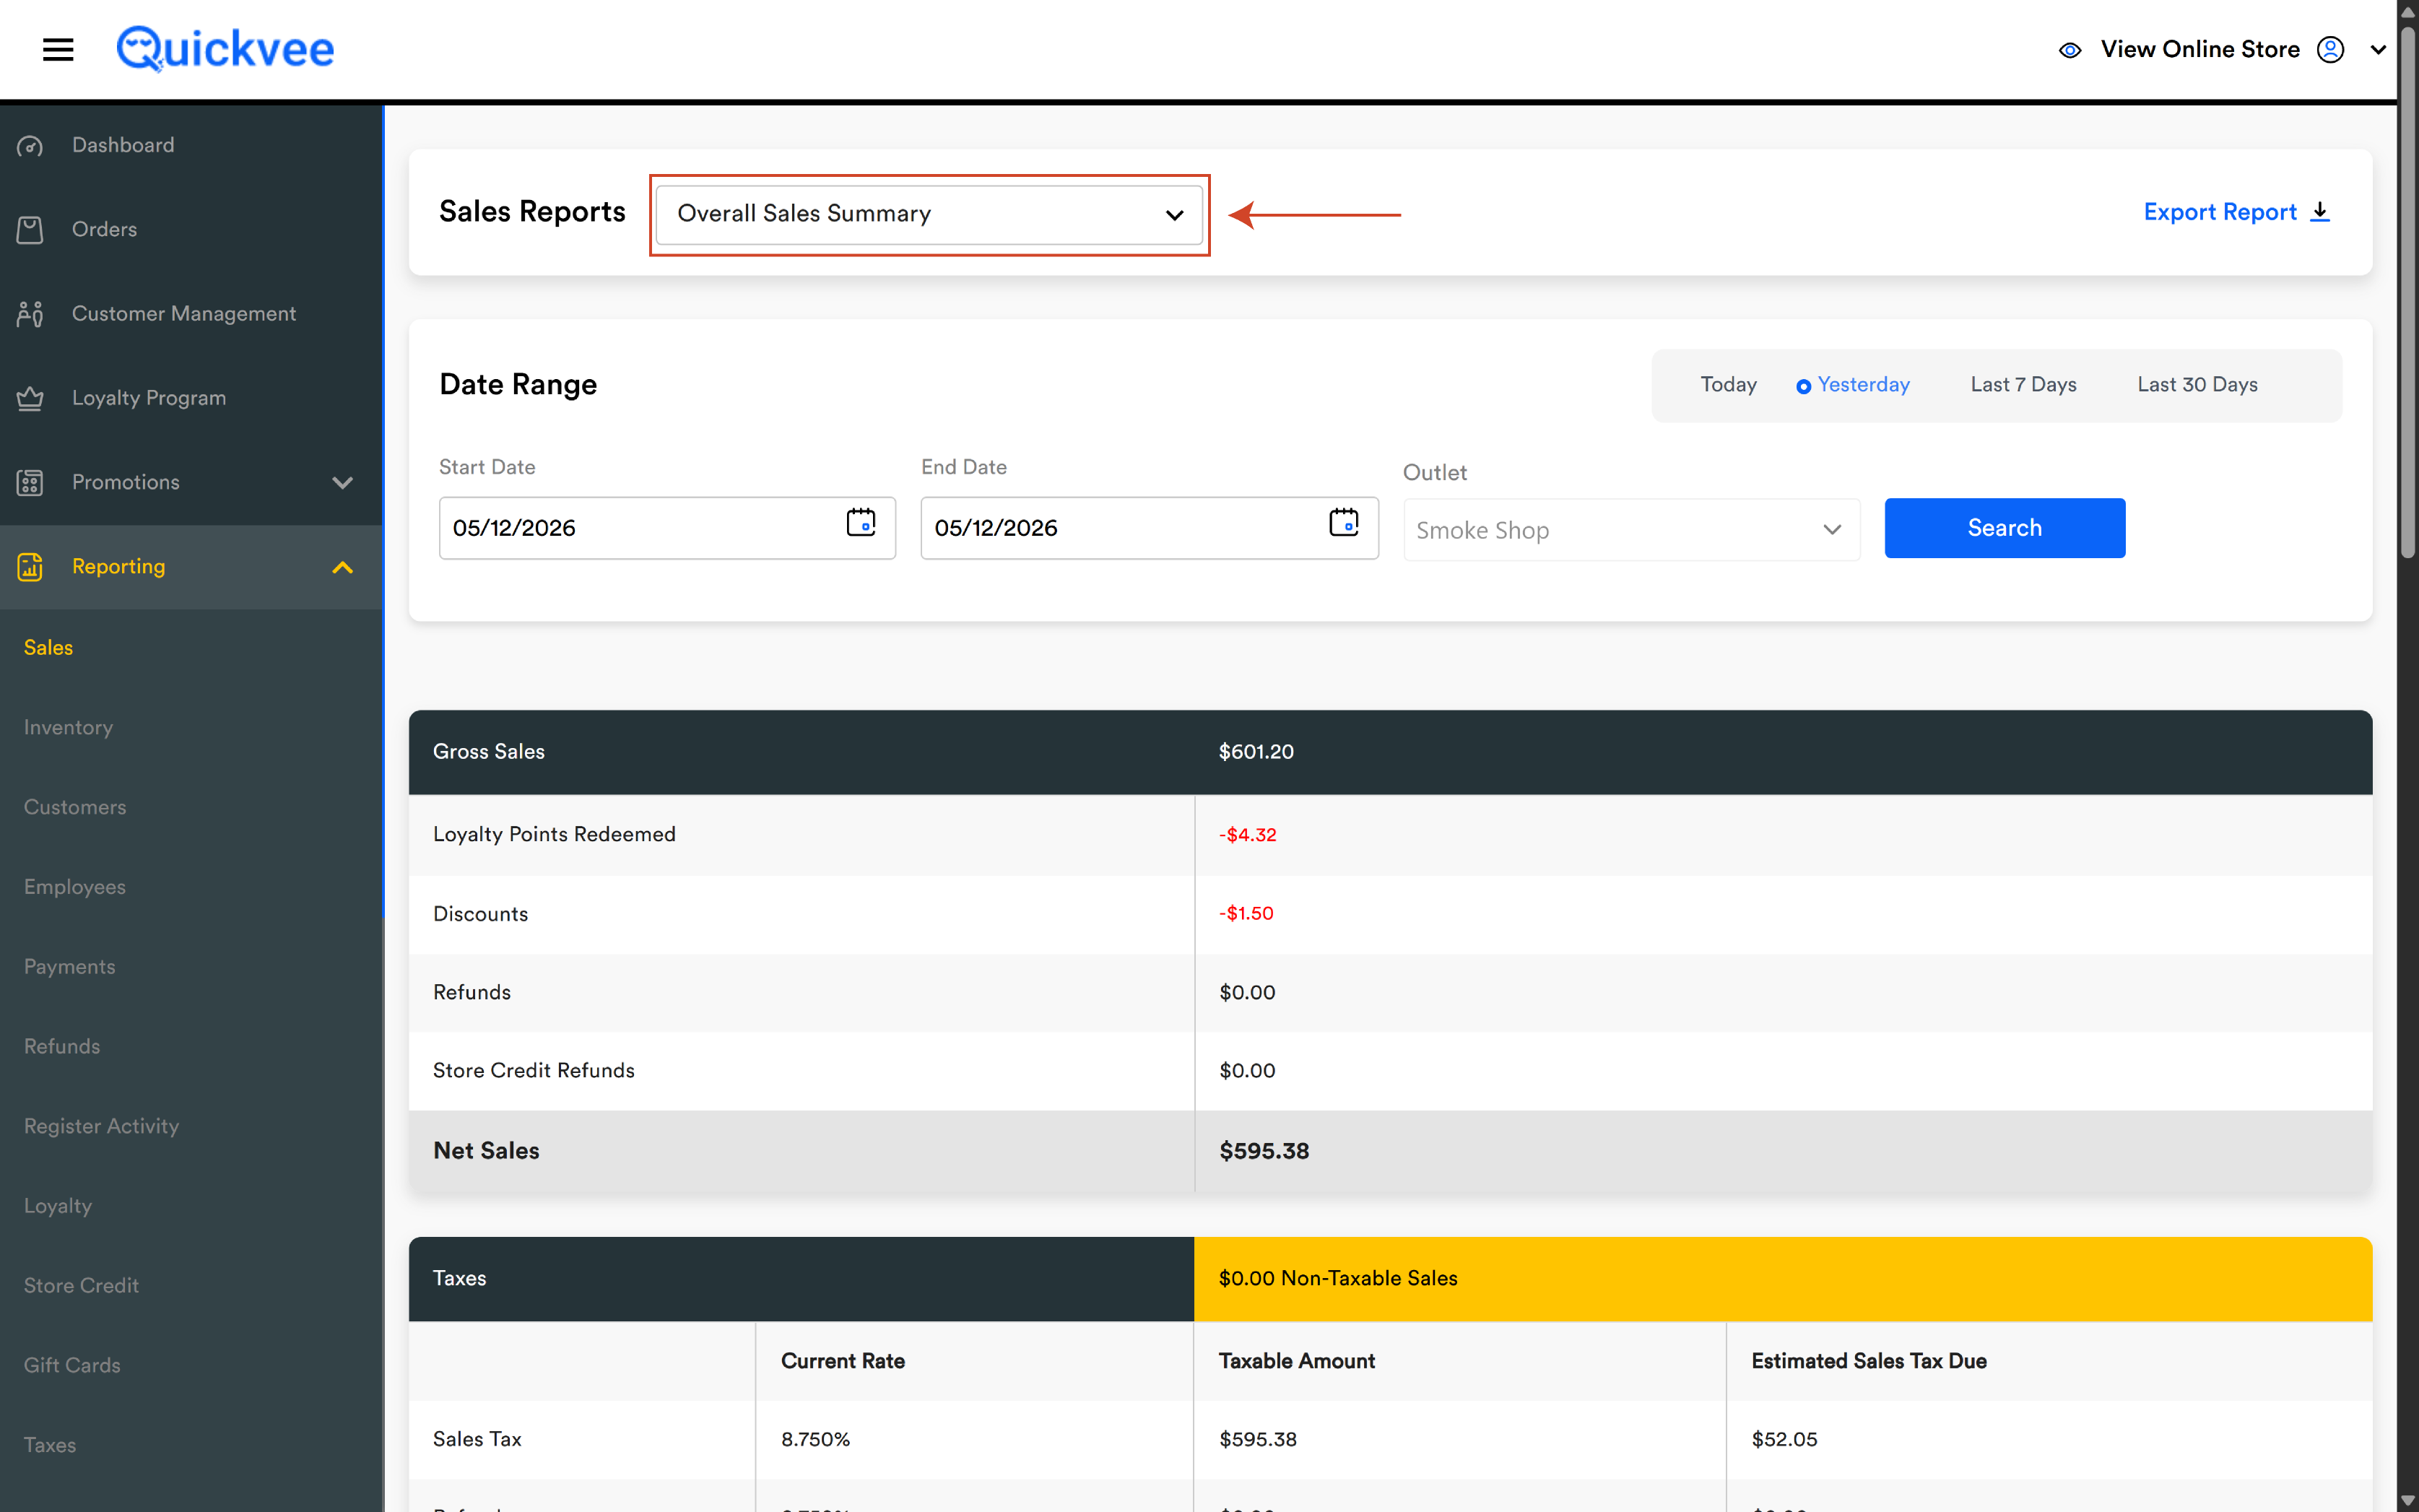
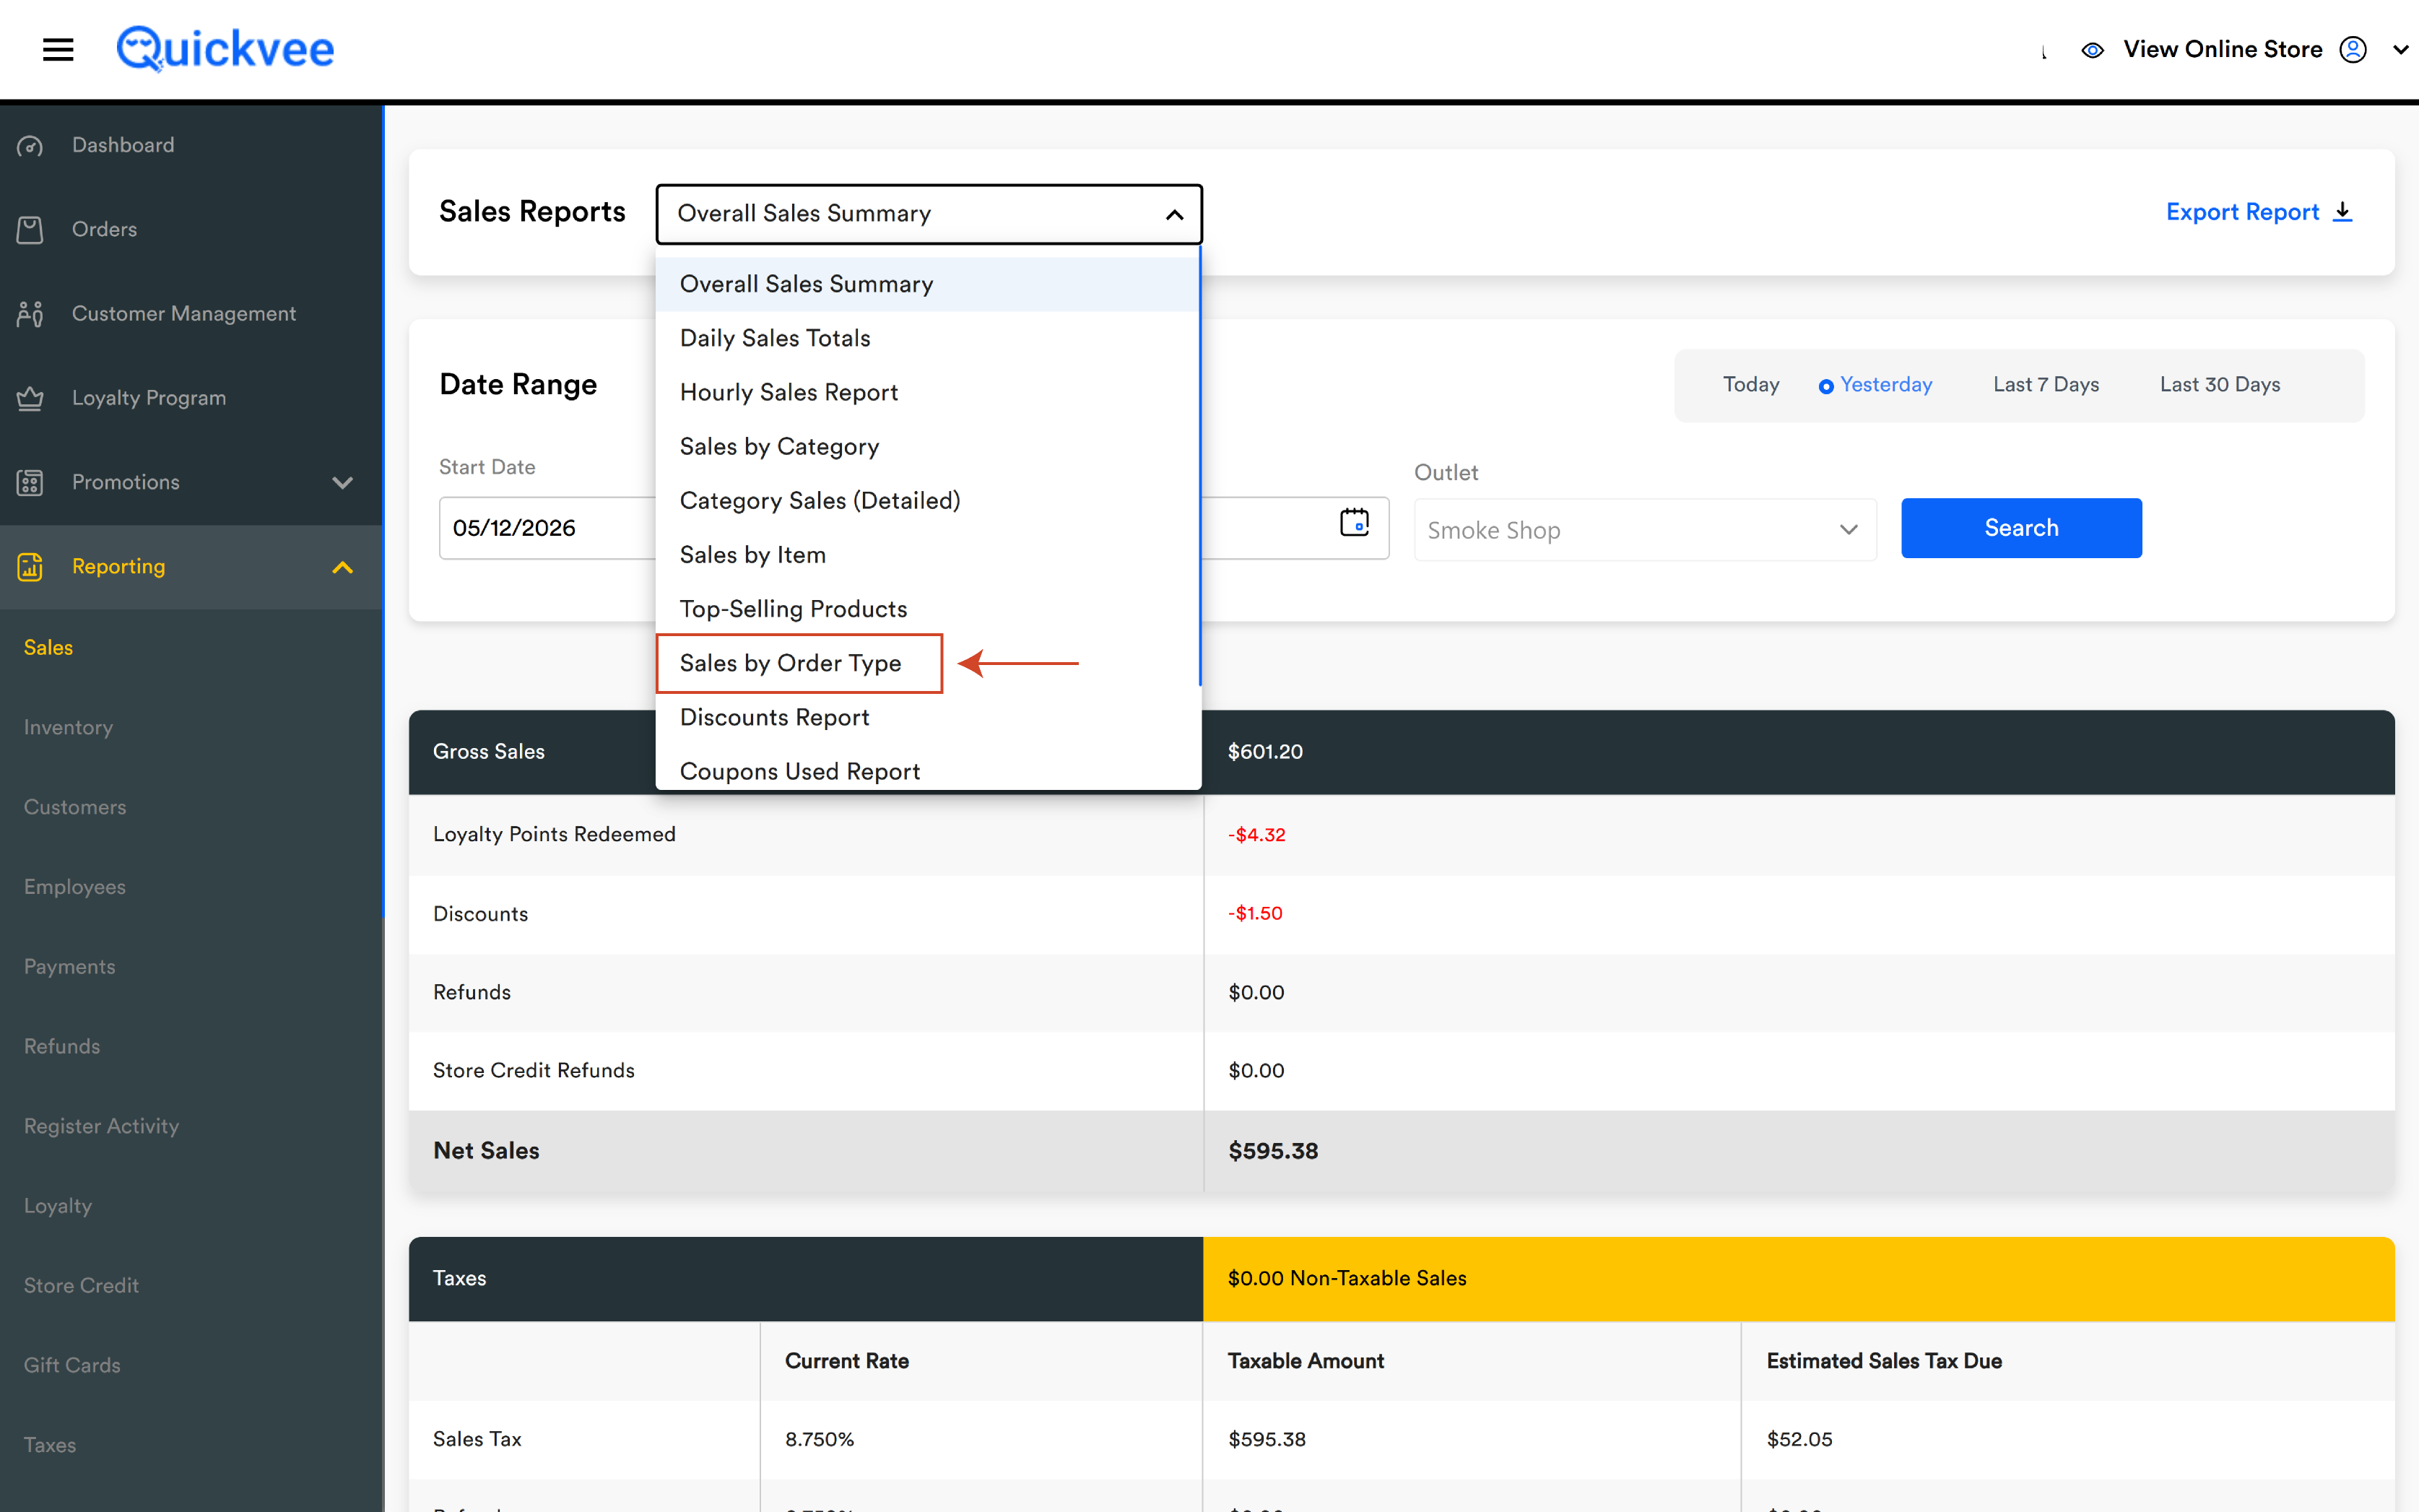
Access path: Quickvee Web → Reporting → Sales Reports → select Sales by Order Type
The filter bar
Quick date filters
|
Quick Filter |
Range Applied |
|---|---|
|
Today |
Today only |
|
Yesterday |
Yesterday only |
|
Last 7 Days |
Rolling 7-day window ending today |
|
Last 14 Days |
Rolling 14-day window ending today |
|
Month to Date |
First of current month through today |
|
Year to Date |
January 1 of current year through today |
Manual date range
Click on the Start Date or End Date field to open the calendar picker and select your custom range — useful for comparing arbitrary periods such as a specific promo week or a holiday weekend.
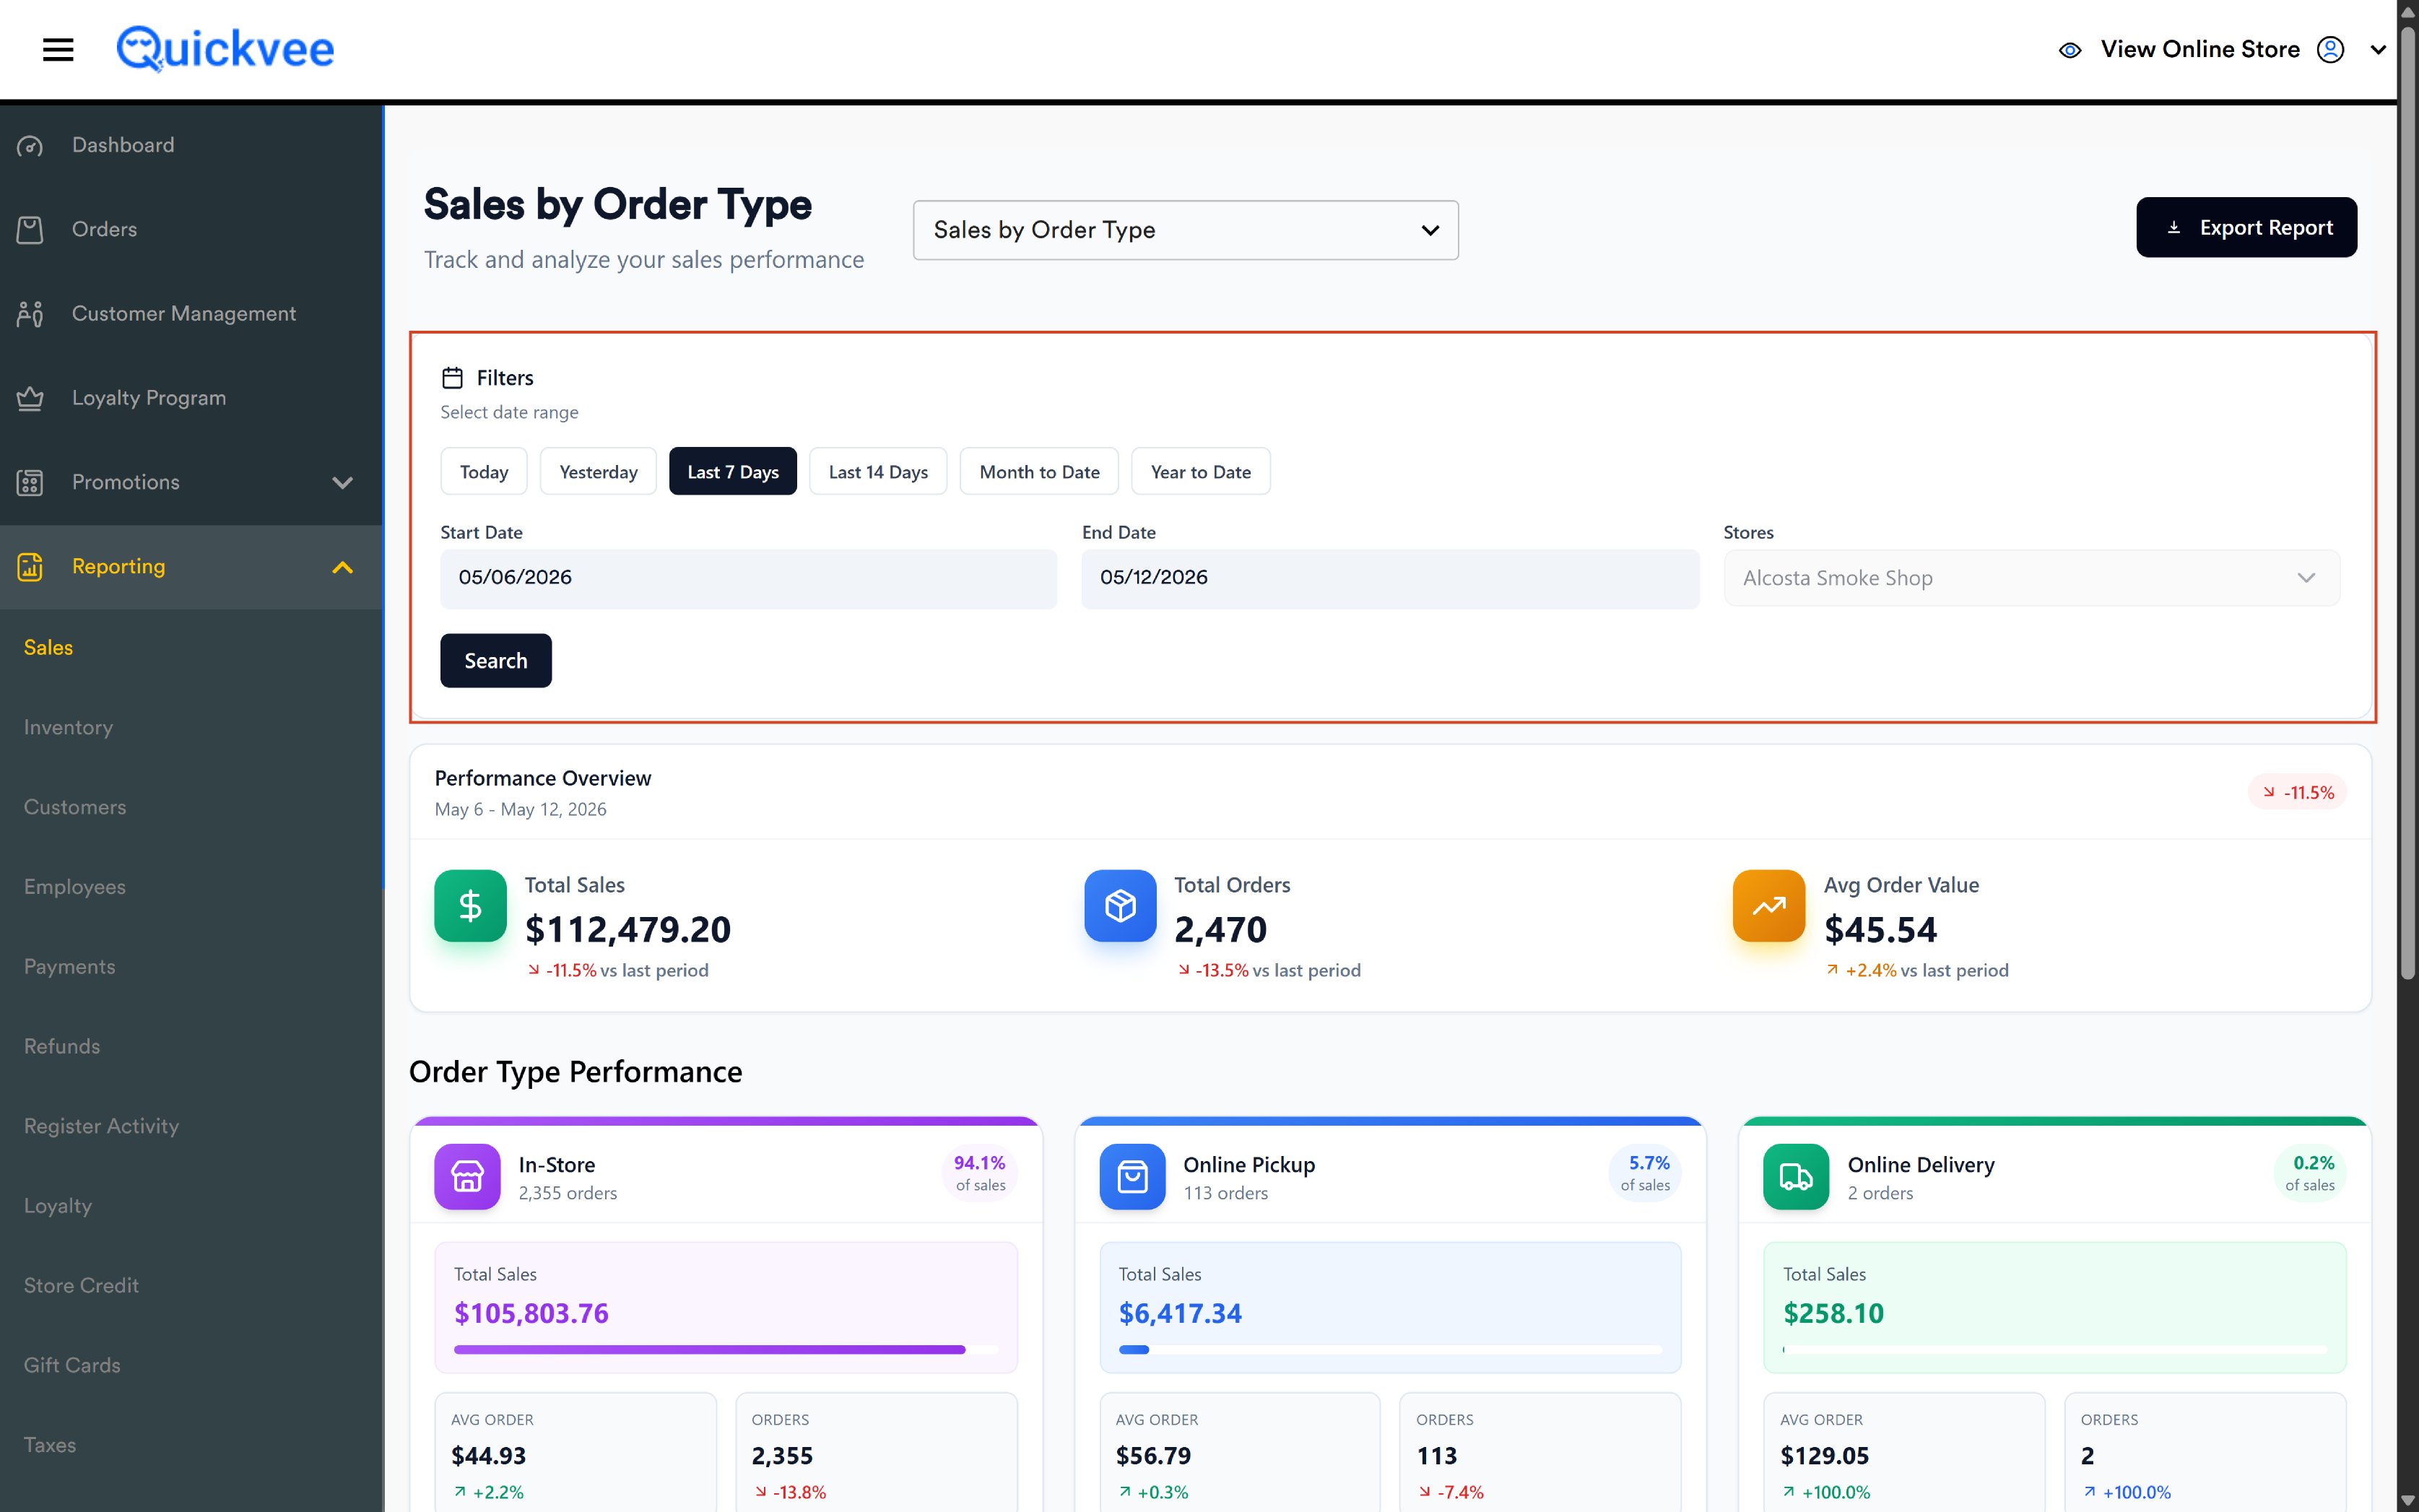
Stores
For multi-store accounts, the Stores dropdown selects which location. Switching stores does not reset the date range — it preserves the selected period when changing outlets to make like-for-like comparisons easier.
Search & Export
-
Search — applies filters and reloads every section
-
Export Report — downloads for sharing or Excel
Performance Overview
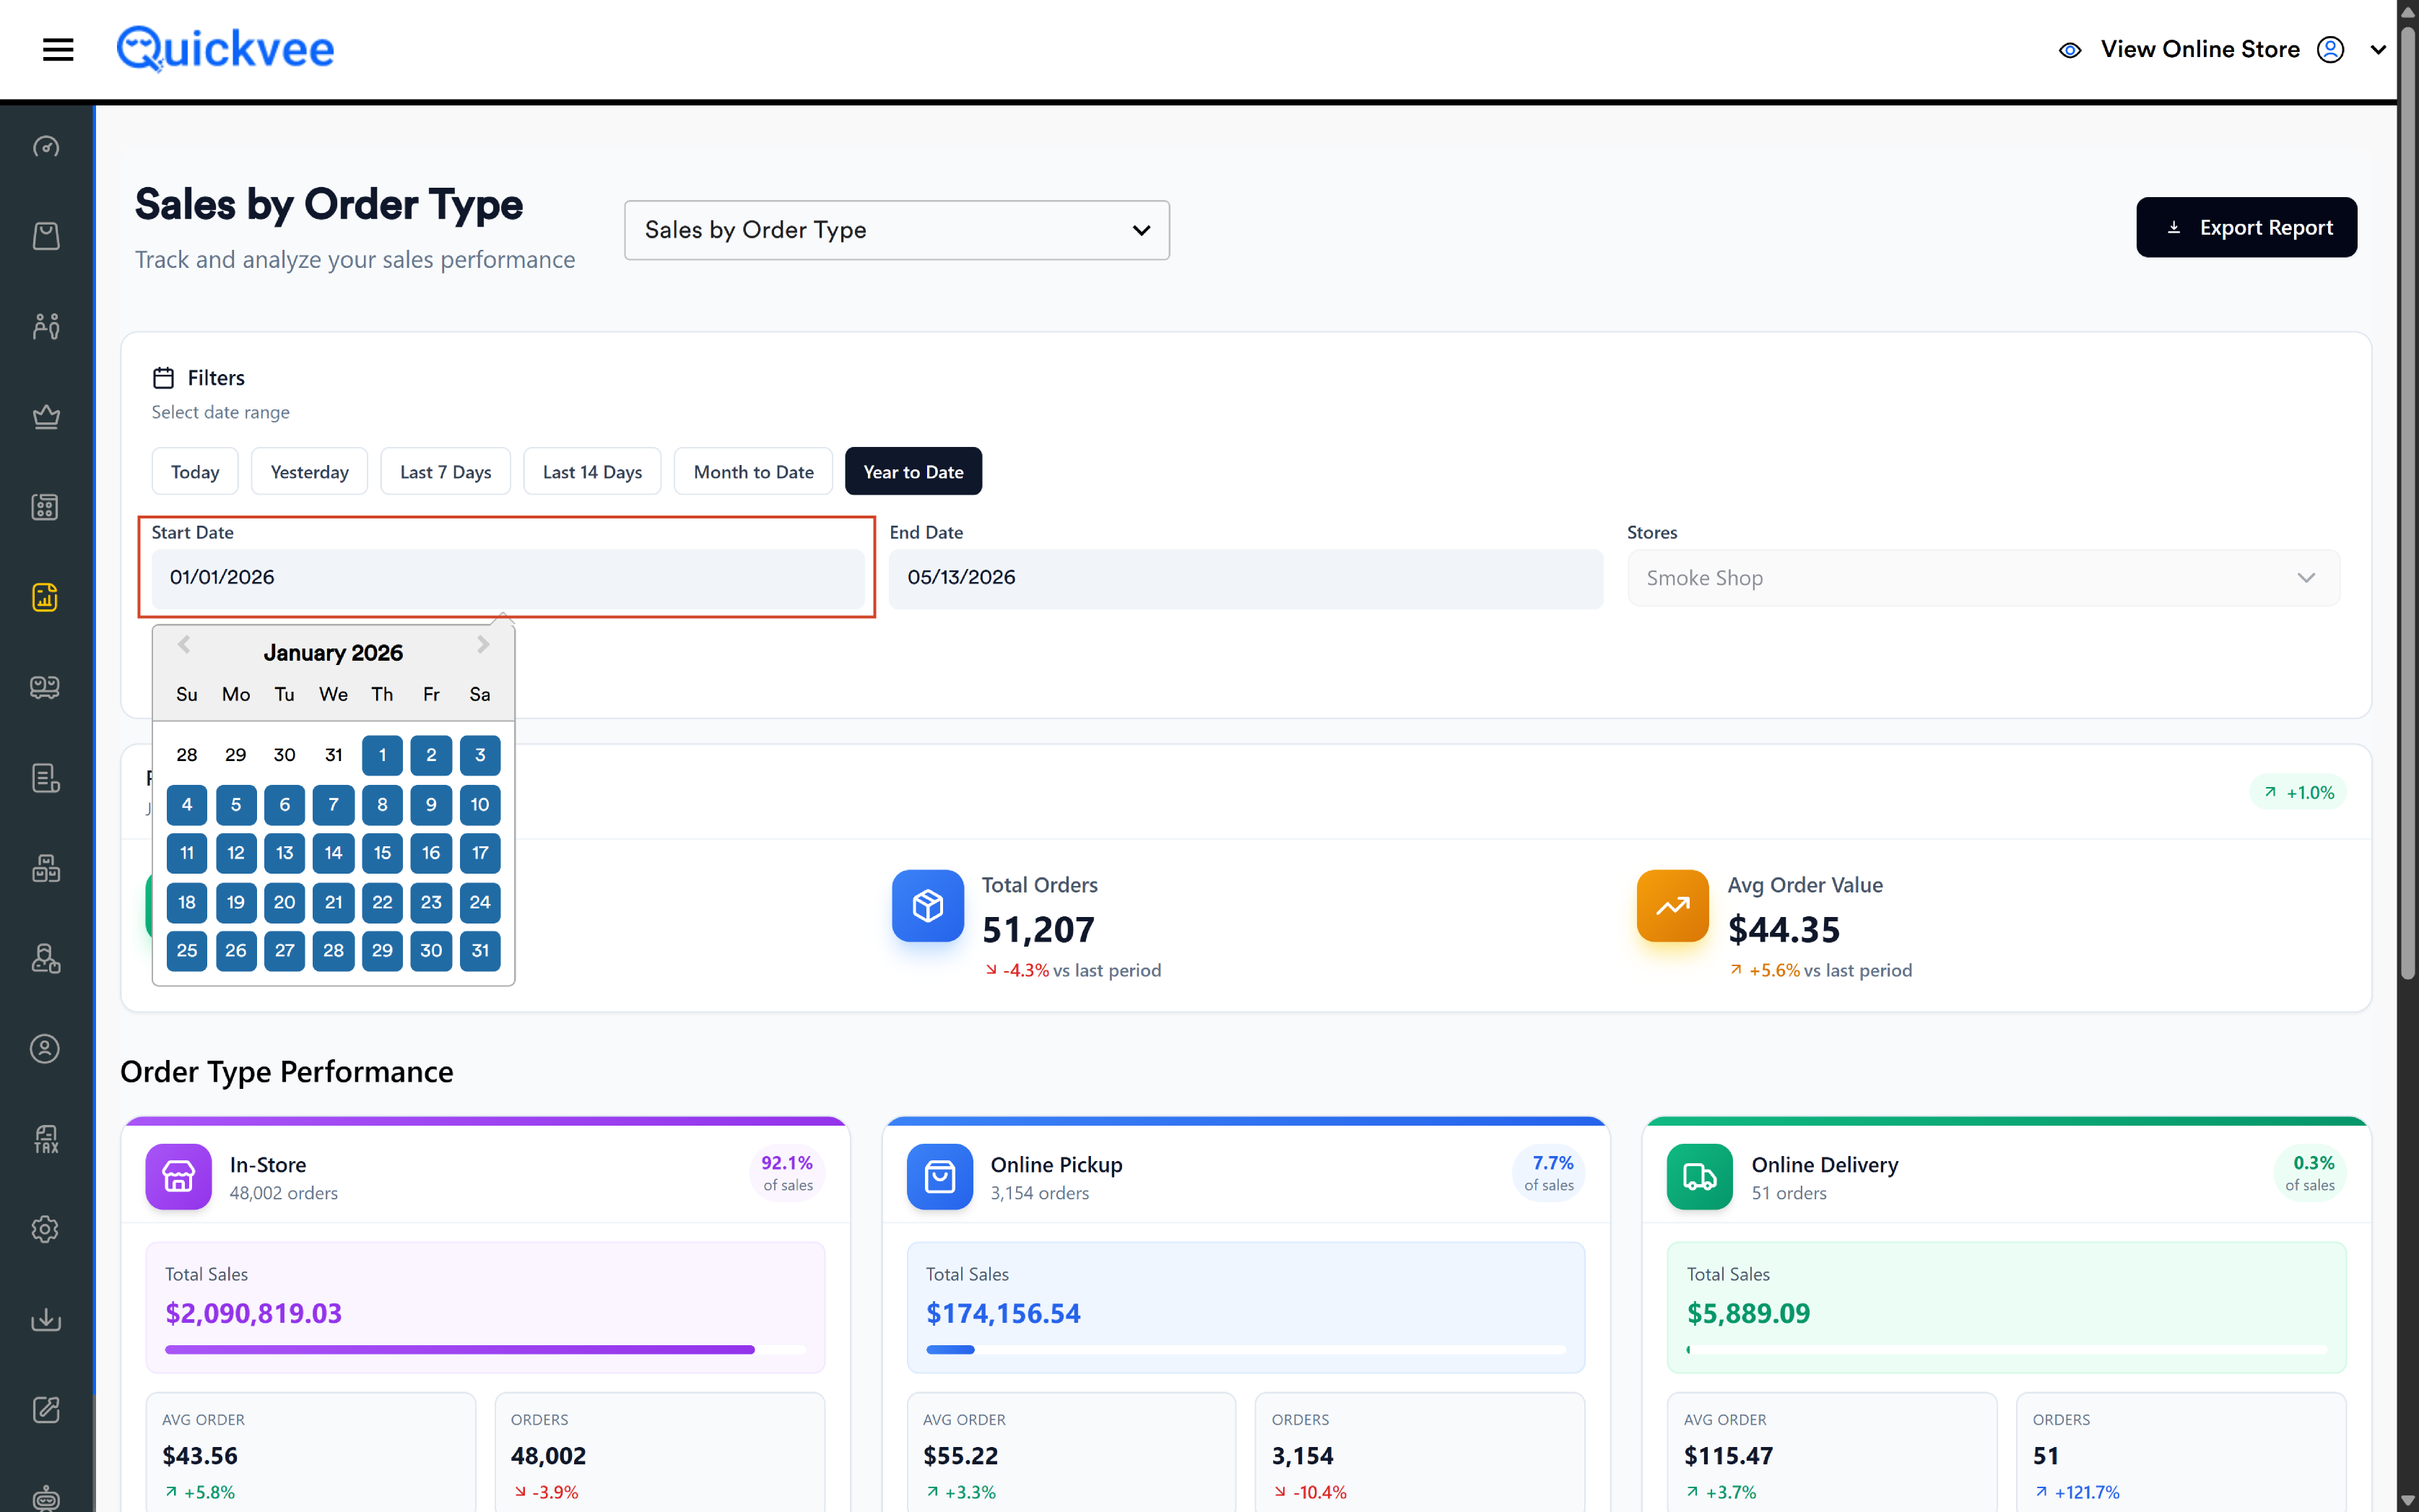
The first section after the filter bar is a high-level summary of the entire date range, regardless of order type.
|
Metric |
What it shows |
|---|---|
|
Total Sales |
Total dollar value of all paid orders in the range, across every order type combined |
|
Total Orders |
Total count of paid orders, across every order type |
|
Avg Order Value |
Total Sales ÷ Total Orders — the average dollar value per order |
Each metric also displays a change indicator versus the previous period (for example, -91.7% vs last period). The "previous period" is the same length immediately before the selected range — a 7-day report compares to the prior 7 days, a single-day report compares to the prior day.
Reading the change indicator: Green up-arrow with a positive percentage means growth versus the prior period; red down-arrow with a negative percentage means decline.
Order Type Performance
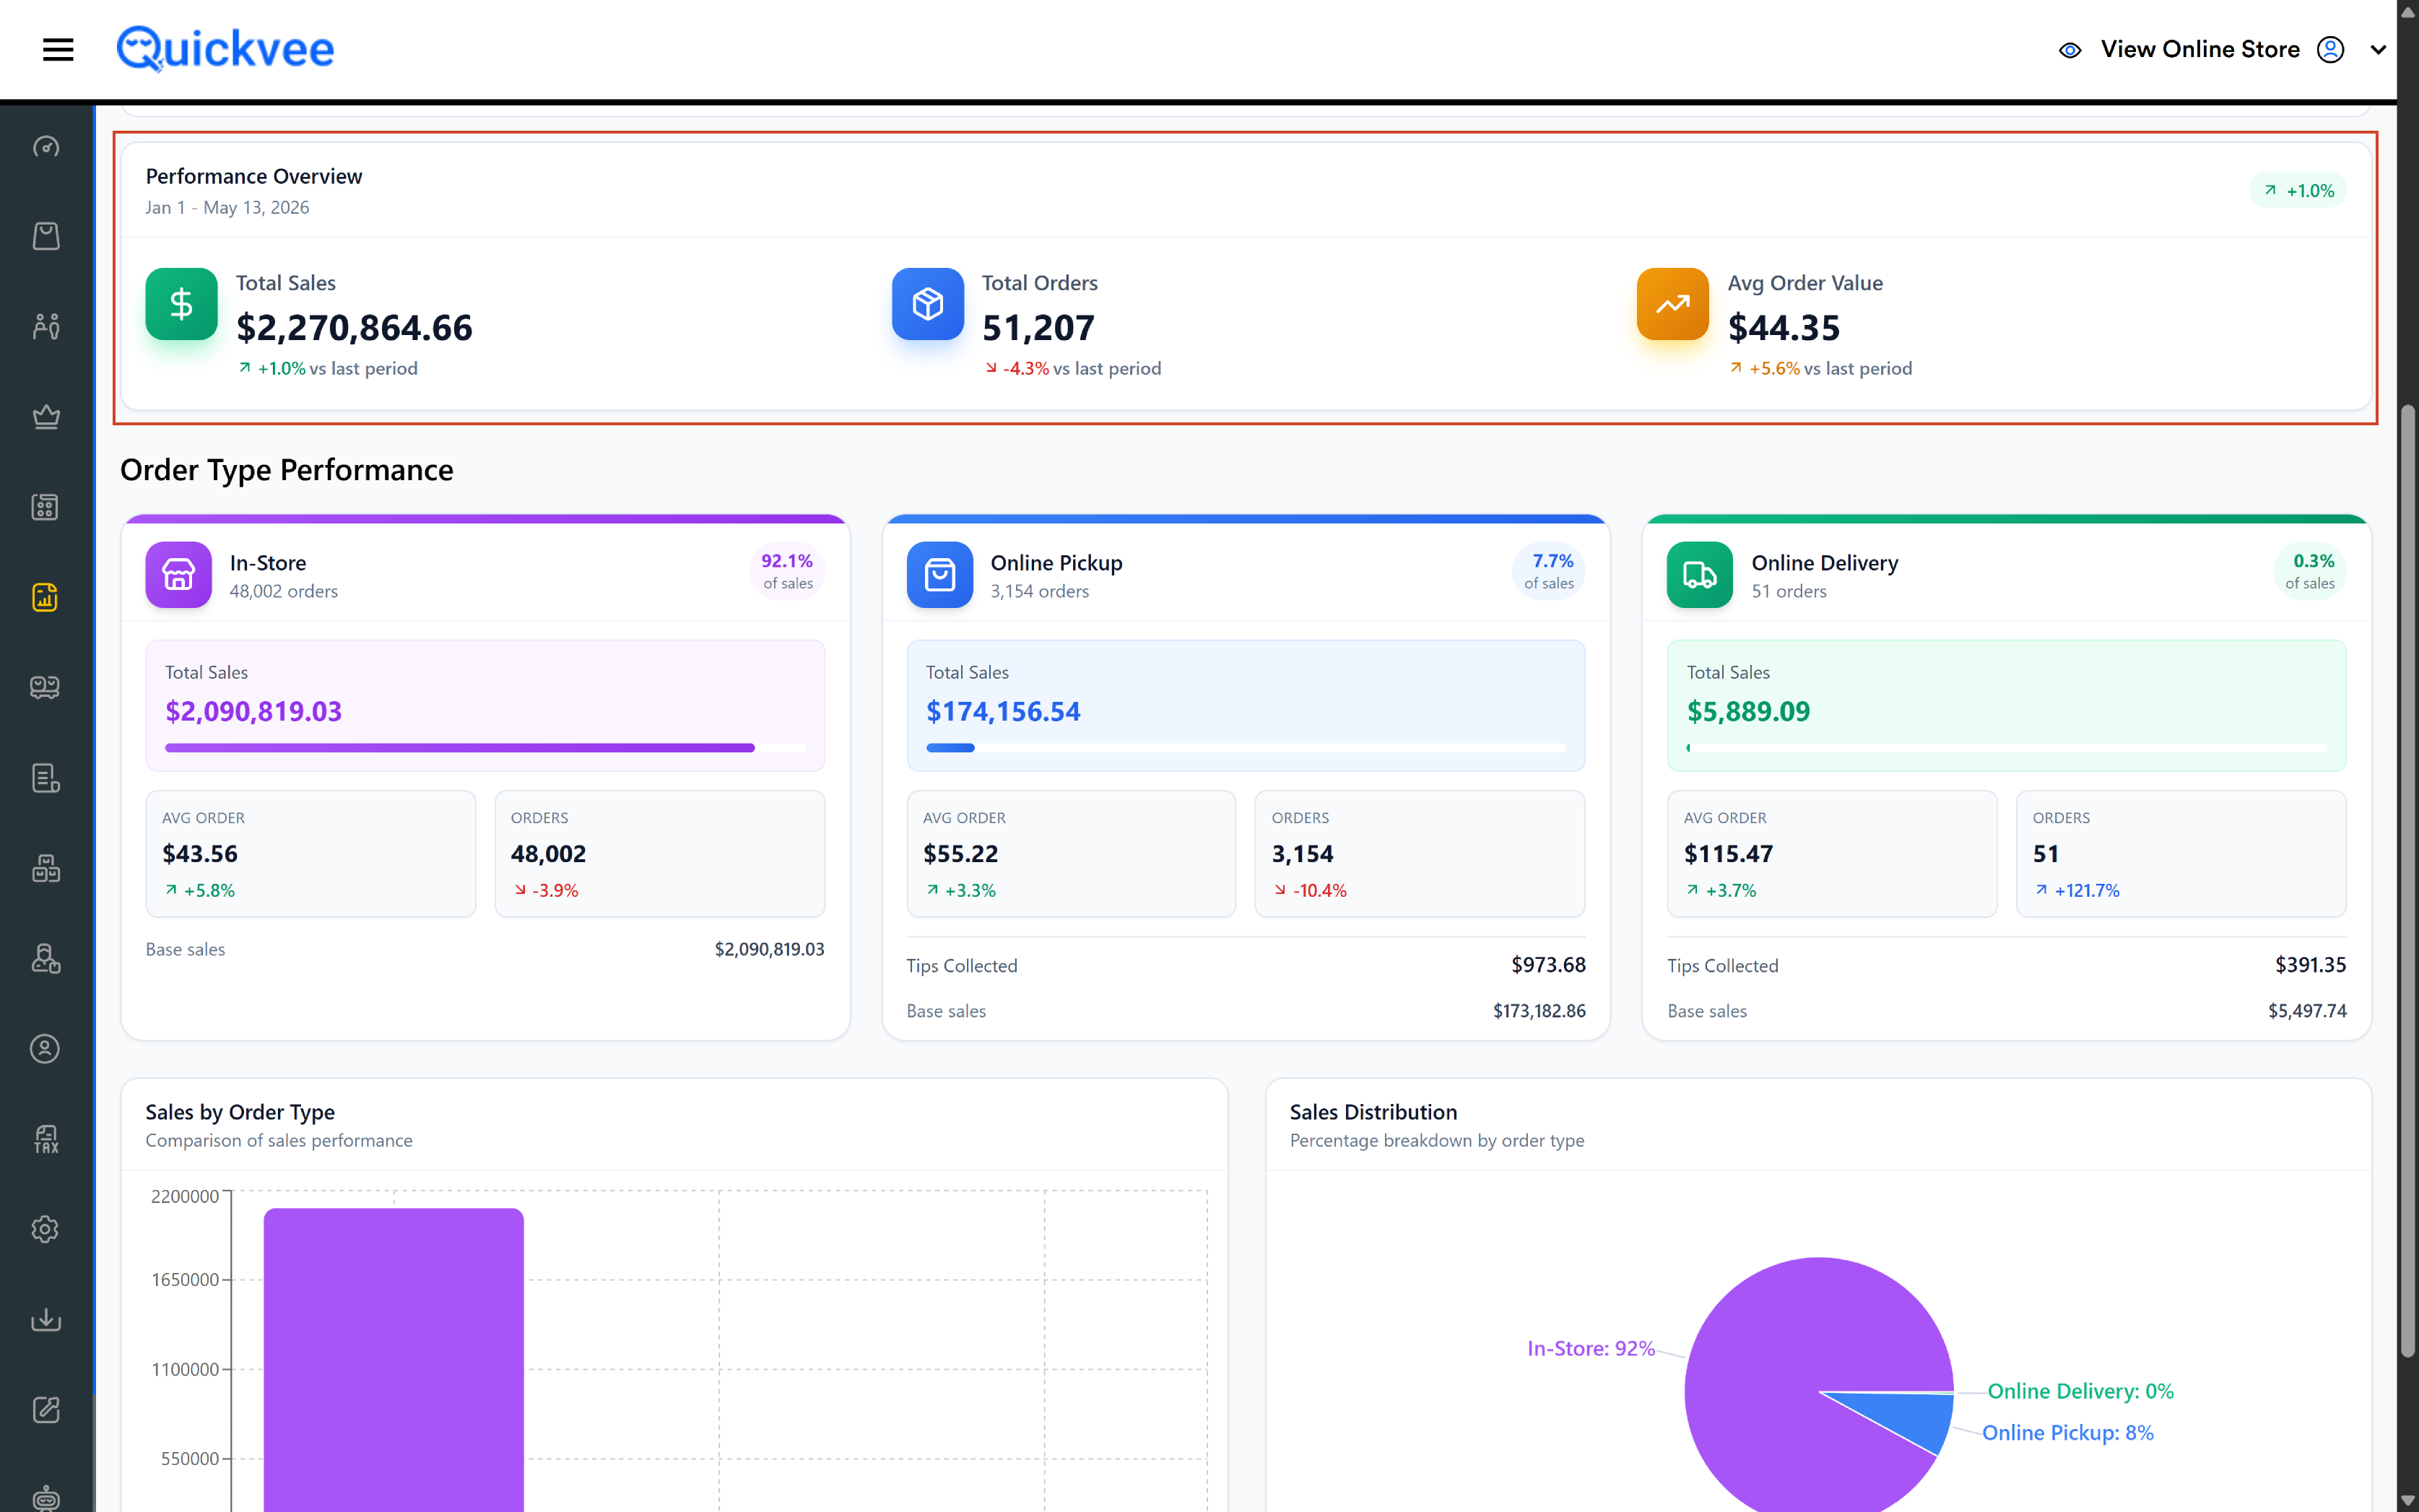
Below the overview, one card appears for each order type that recorded activity in the range.
|
Element |
What it shows |
|---|---|
|
Order Type Name |
In-Store, Online Pickup, or Online Delivery |
|
Order Count |
Number of orders of this type in the range |
|
% of Sales |
Share of the period's Total Sales contributed by this order type |
|
Total Sales (bar) |
Dollar value with a horizontal bar visually showing share of the largest channel |
|
Avg Order |
Average dollar value with period-over-period change indicator |
|
Orders |
Count of orders with period-over-period change indicator |
|
Base Sales |
Total Sales for this type (matches the bar value) |
Reading the cards
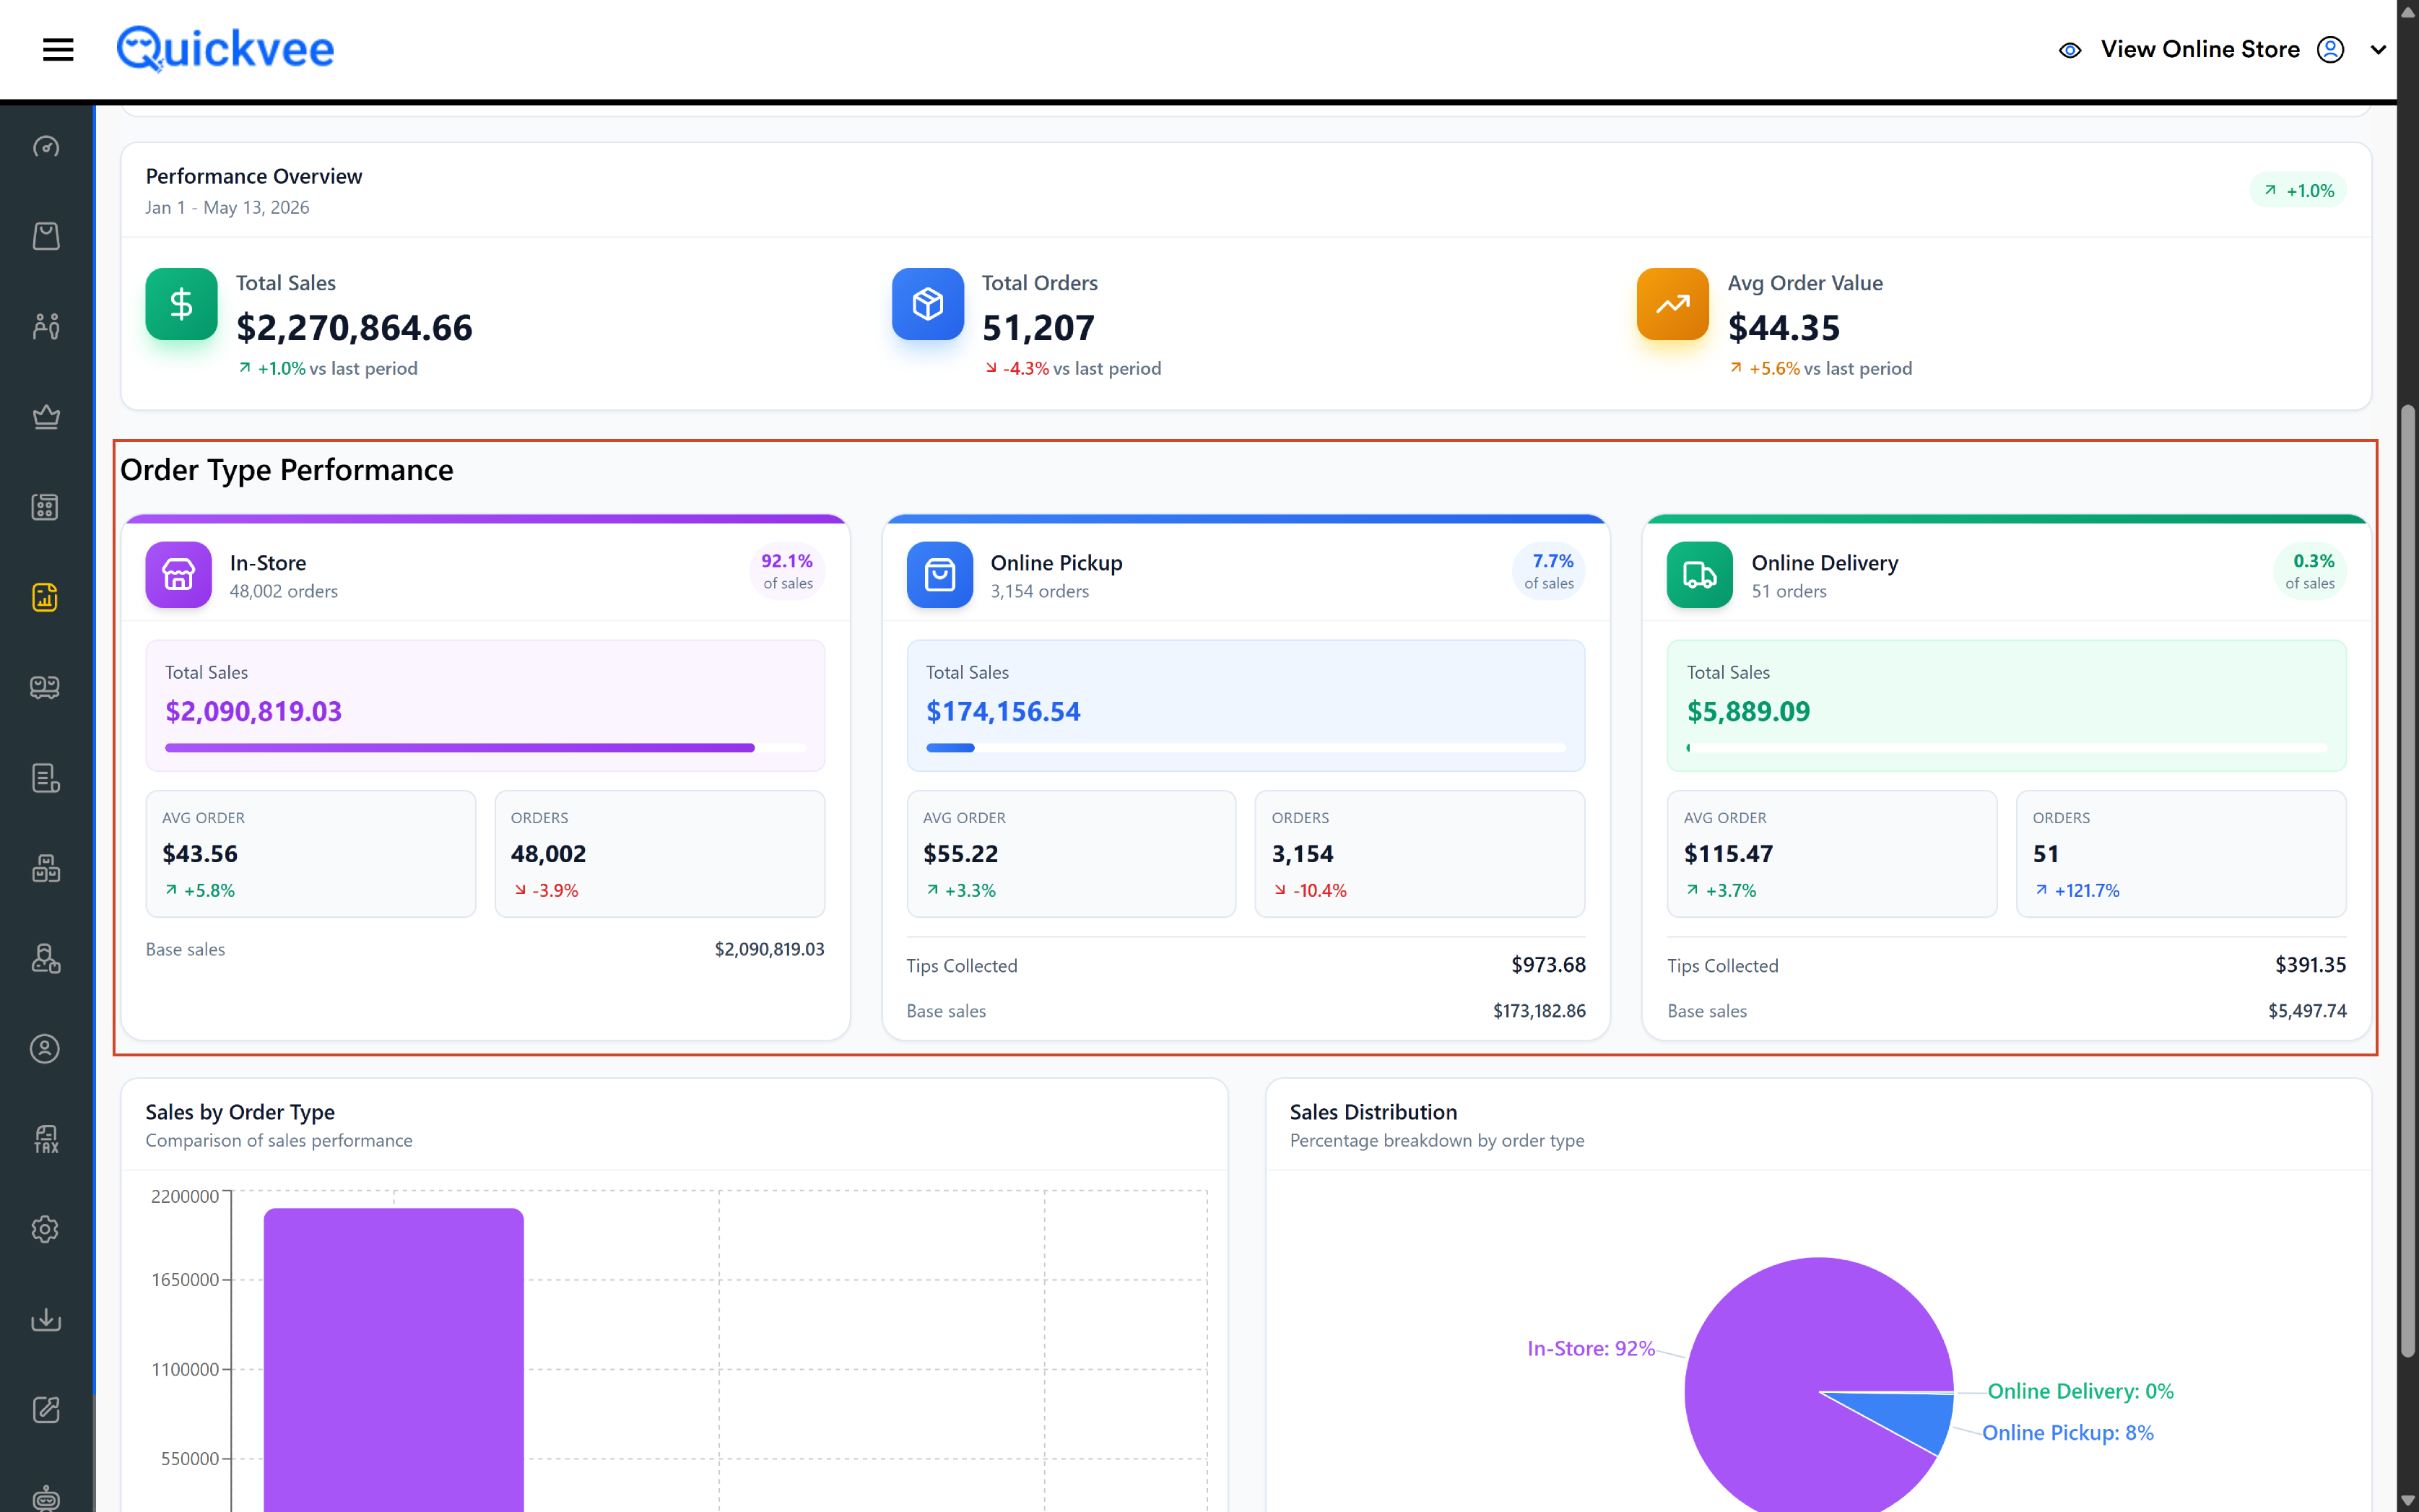
The two indicators together tell a richer story than either alone:
-
Avg Order up + Orders up — healthy growth in both volume and ticket size
-
Avg Order up + Orders down — fewer orders but bigger baskets — possibly a shift toward larger ticket buyers
-
Avg Order down + Orders up — more customers spending less per order — possibly promo-driven traffic
-
Avg Order down + Orders down — channel is in decline on both axes; investigate
Charts
Sales by Order Type (bar chart)
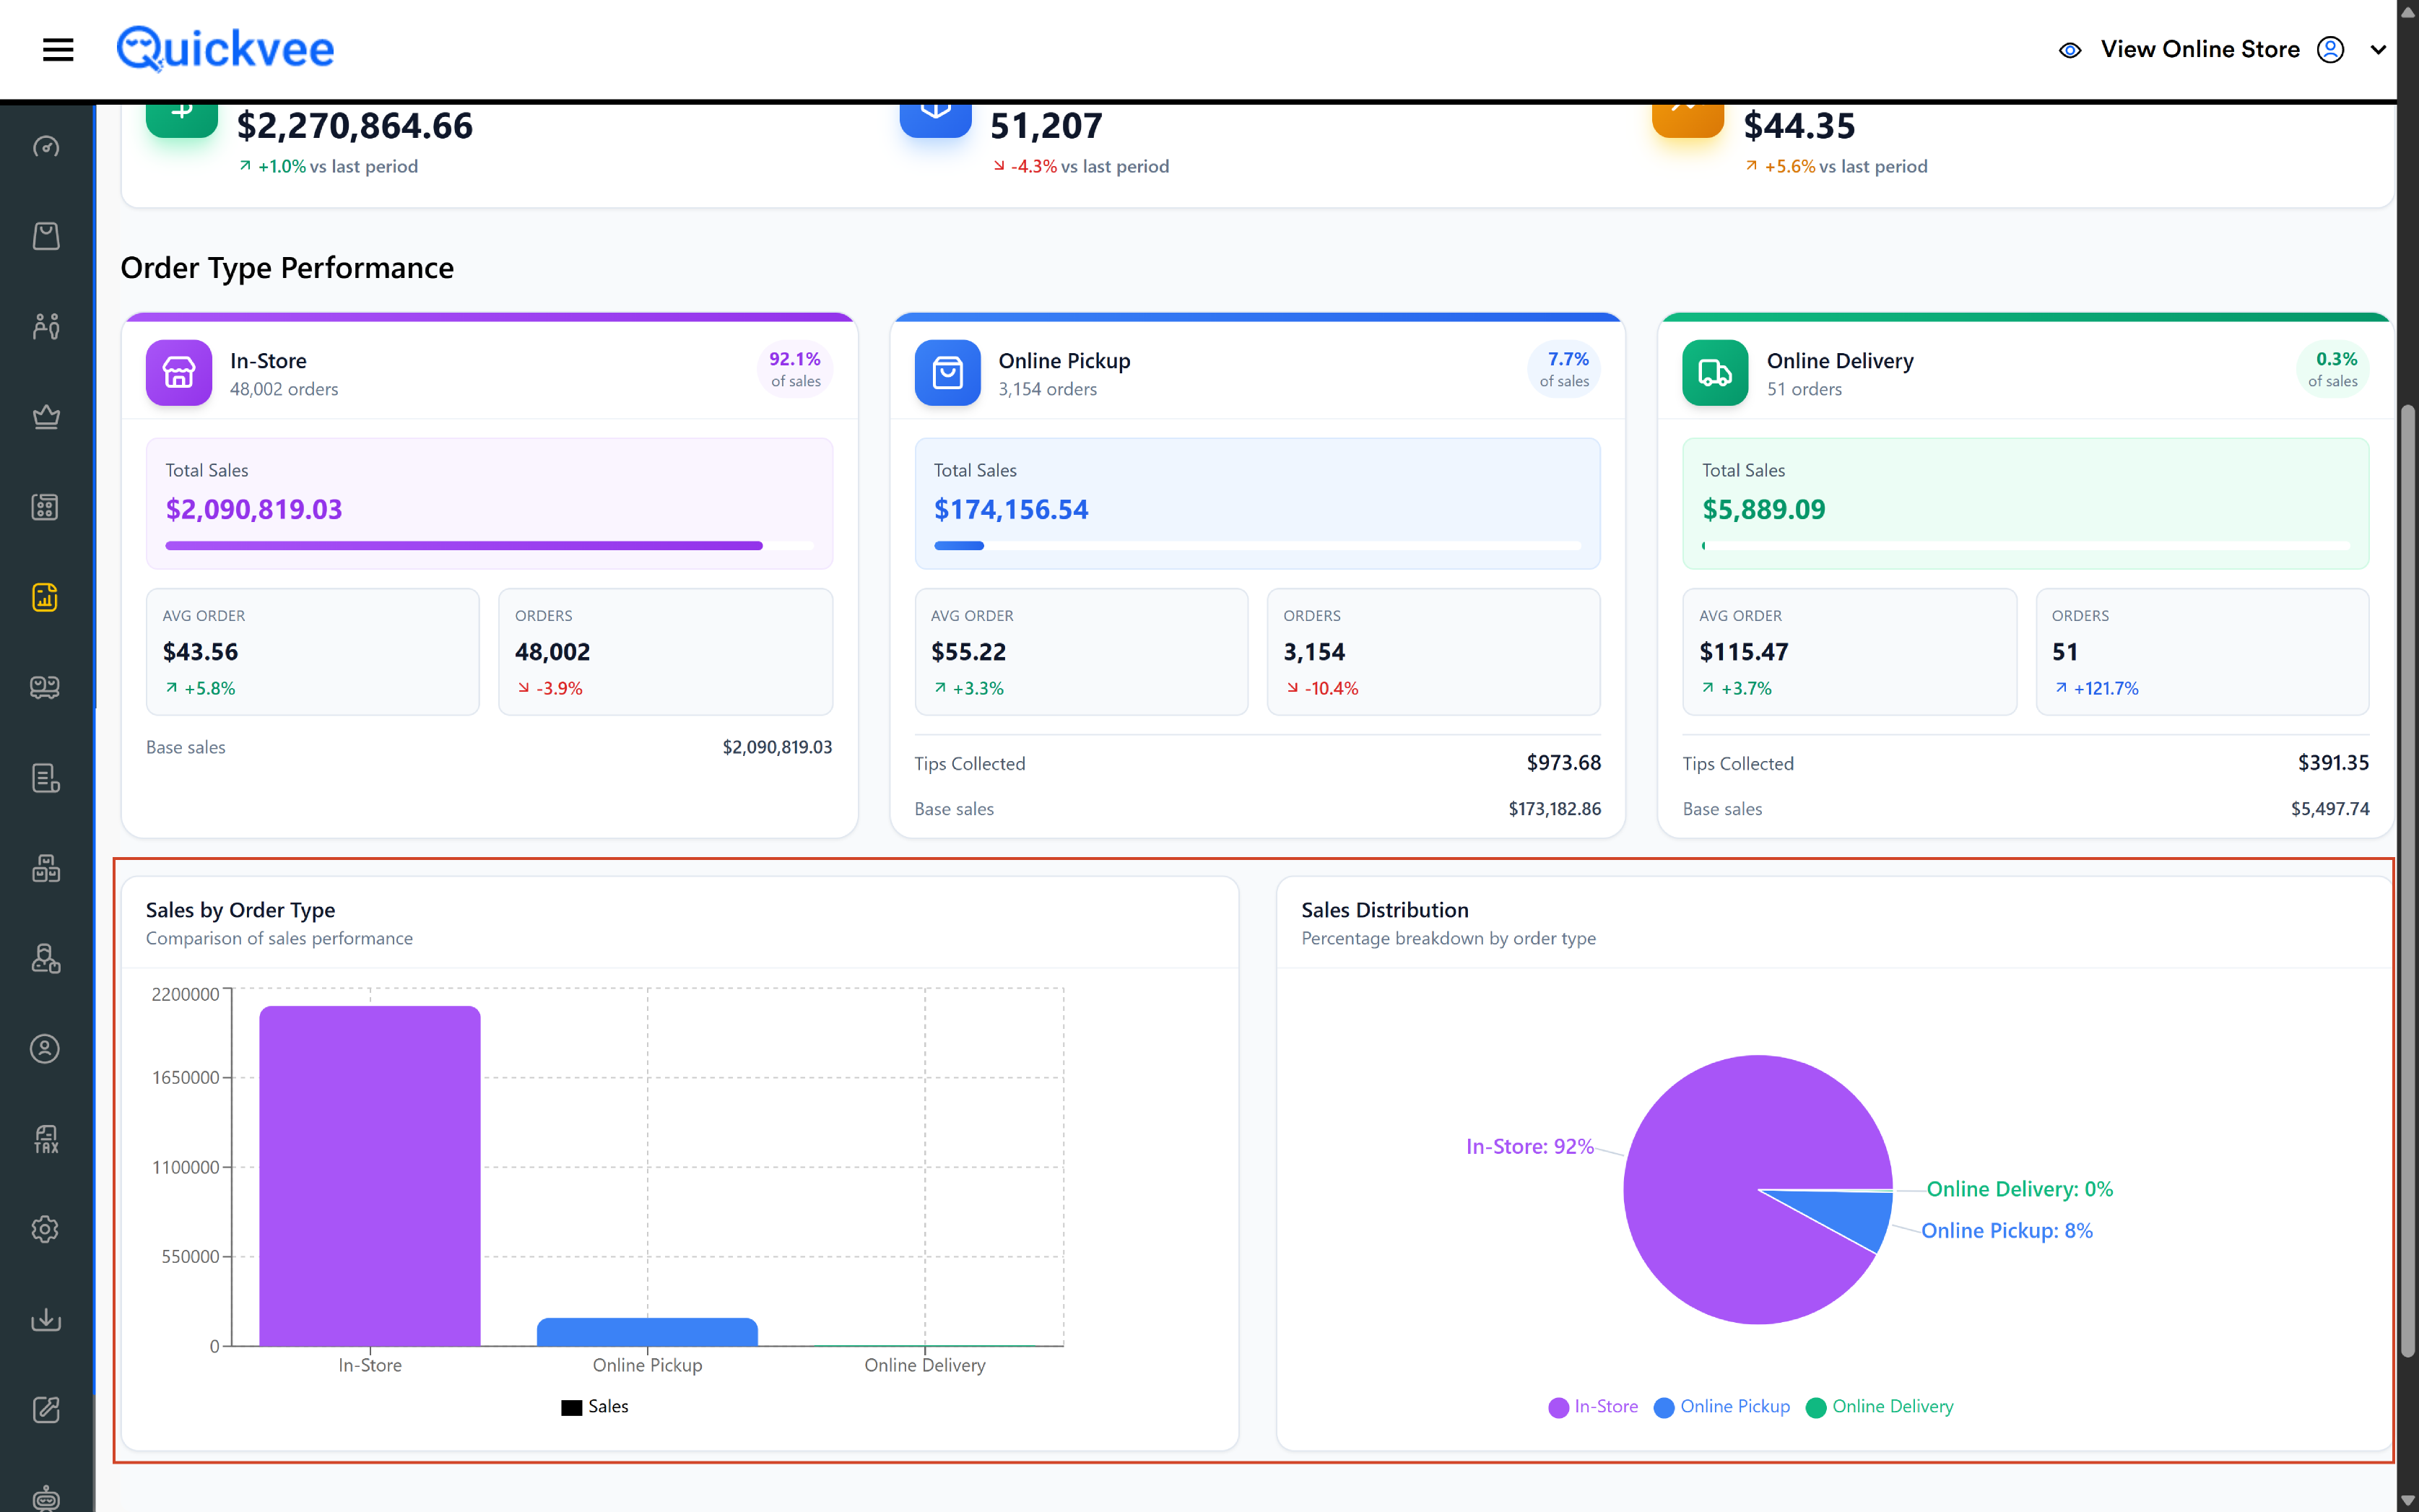
A vertical bar chart comparing the dollar value of each order type. The dominant channel is immediately visible by bar height.
Sales Distribution (pie chart)
A pie chart showing each order type's share of total sales as a percentage. Order types with 0% sales still appear in the legend (e.g. Online Delivery: 0%) so the merchant can confirm the report ran for that channel and it simply had no activity, rather than worrying the channel was excluded.
Common workflows
"Is online ordering pulling its weight?"
Quick filter → Last 30 Days → Search. Read the Sales Distribution pie chart. If Online Pickup + Online Delivery together represent less than expected of total sales, consider promo, marketing, or menu visibility on the online storefront.
"Did the in-store rush yesterday match last week?"
Quick filter → Yesterday → Search. Note the In-Store card's Total Sales and the change indicator. The change indicator already compares to the prior day — no second query needed.
"Is the online channel growing?"
Run for Last 7 Days vs. the previous 7 days. Read the Online Pickup card's Orders change indicator. A consistent positive percentage week over week is steady growth.
"Compare two stores on the same period"
Set the date range, run for store A, export. Switch the Stores dropdown to store B (the date range stays), tap Search, export. Compare the two side by side.
"Did the discount campaign shift sales online?"
Run for the campaign window and the prior window of equal length. Compare the % of Sales for Online Pickup before and after — a rising share confirms the campaign succeeded in shifting traffic; unchanged means it drove total volume without changing channel mix.
Important notes
Order type is set at order creation, not at fulfillment. An order placed in the online storefront and picked up at the counter is Online Pickup, not In-Store. An order entered on the POS register is In-Store regardless of how the customer takes it home.
Refunded orders reduce the totals. A fully refunded order reduces both the order count and the total sales for its order type. Partial refunds reduce the sales amount only — the order count is unchanged.
Online Delivery includes third-party delivery channels (where enabled, such as Uber). If your store has not enabled an online delivery channel, this card will always show $0.00 and the pie chart slice will be 0%.
Period-over-period comparison uses the same length immediately before the selected range. A 7-day report compares to the 7 days before that. A custom range from Mar 1–15 compares to Feb 14–28. No calendar-month or year-on-year comparison is built in — use the manual date pickers.
Filters do not auto-apply. Changing a date or store requires tapping Search.
Date range persists when switching stores, so the merchant can run identical-period reports across multiple outlets quickly.
Sales by Order Type was previously called "Order Type Report". The report content is the same; the new name appears in the Sales Reports dropdown for clarity.
Calculation reference
|
Field |
Formula |
|---|---|
|
Total Orders |
|
|
Total Sales |
|
|
Sales without Tips |
|
|
Average Order Value |
|
|
Sales Distribution % |
|
|
Refund Amount Without Tip |
|
Order type logic: is_online = 0 → In-Store; is_online = 1 → Online (further split by order method). Only paid orders are included. Loyalty point refund amount is excluded from refund sales calculations.