
The Daily Sales Totals report is the simplest report in the Sales Reports group: one row per day in the selected range, with that day's total sales. No charts, no breakdowns by tender or category — just a clean day-by-day snapshot of gross daily revenue, with a grand total at the bottom. Merchants use it for at-a-glance daily reconciliation, week-over-week trend spotting, and as the starting point for any deeper investigation.
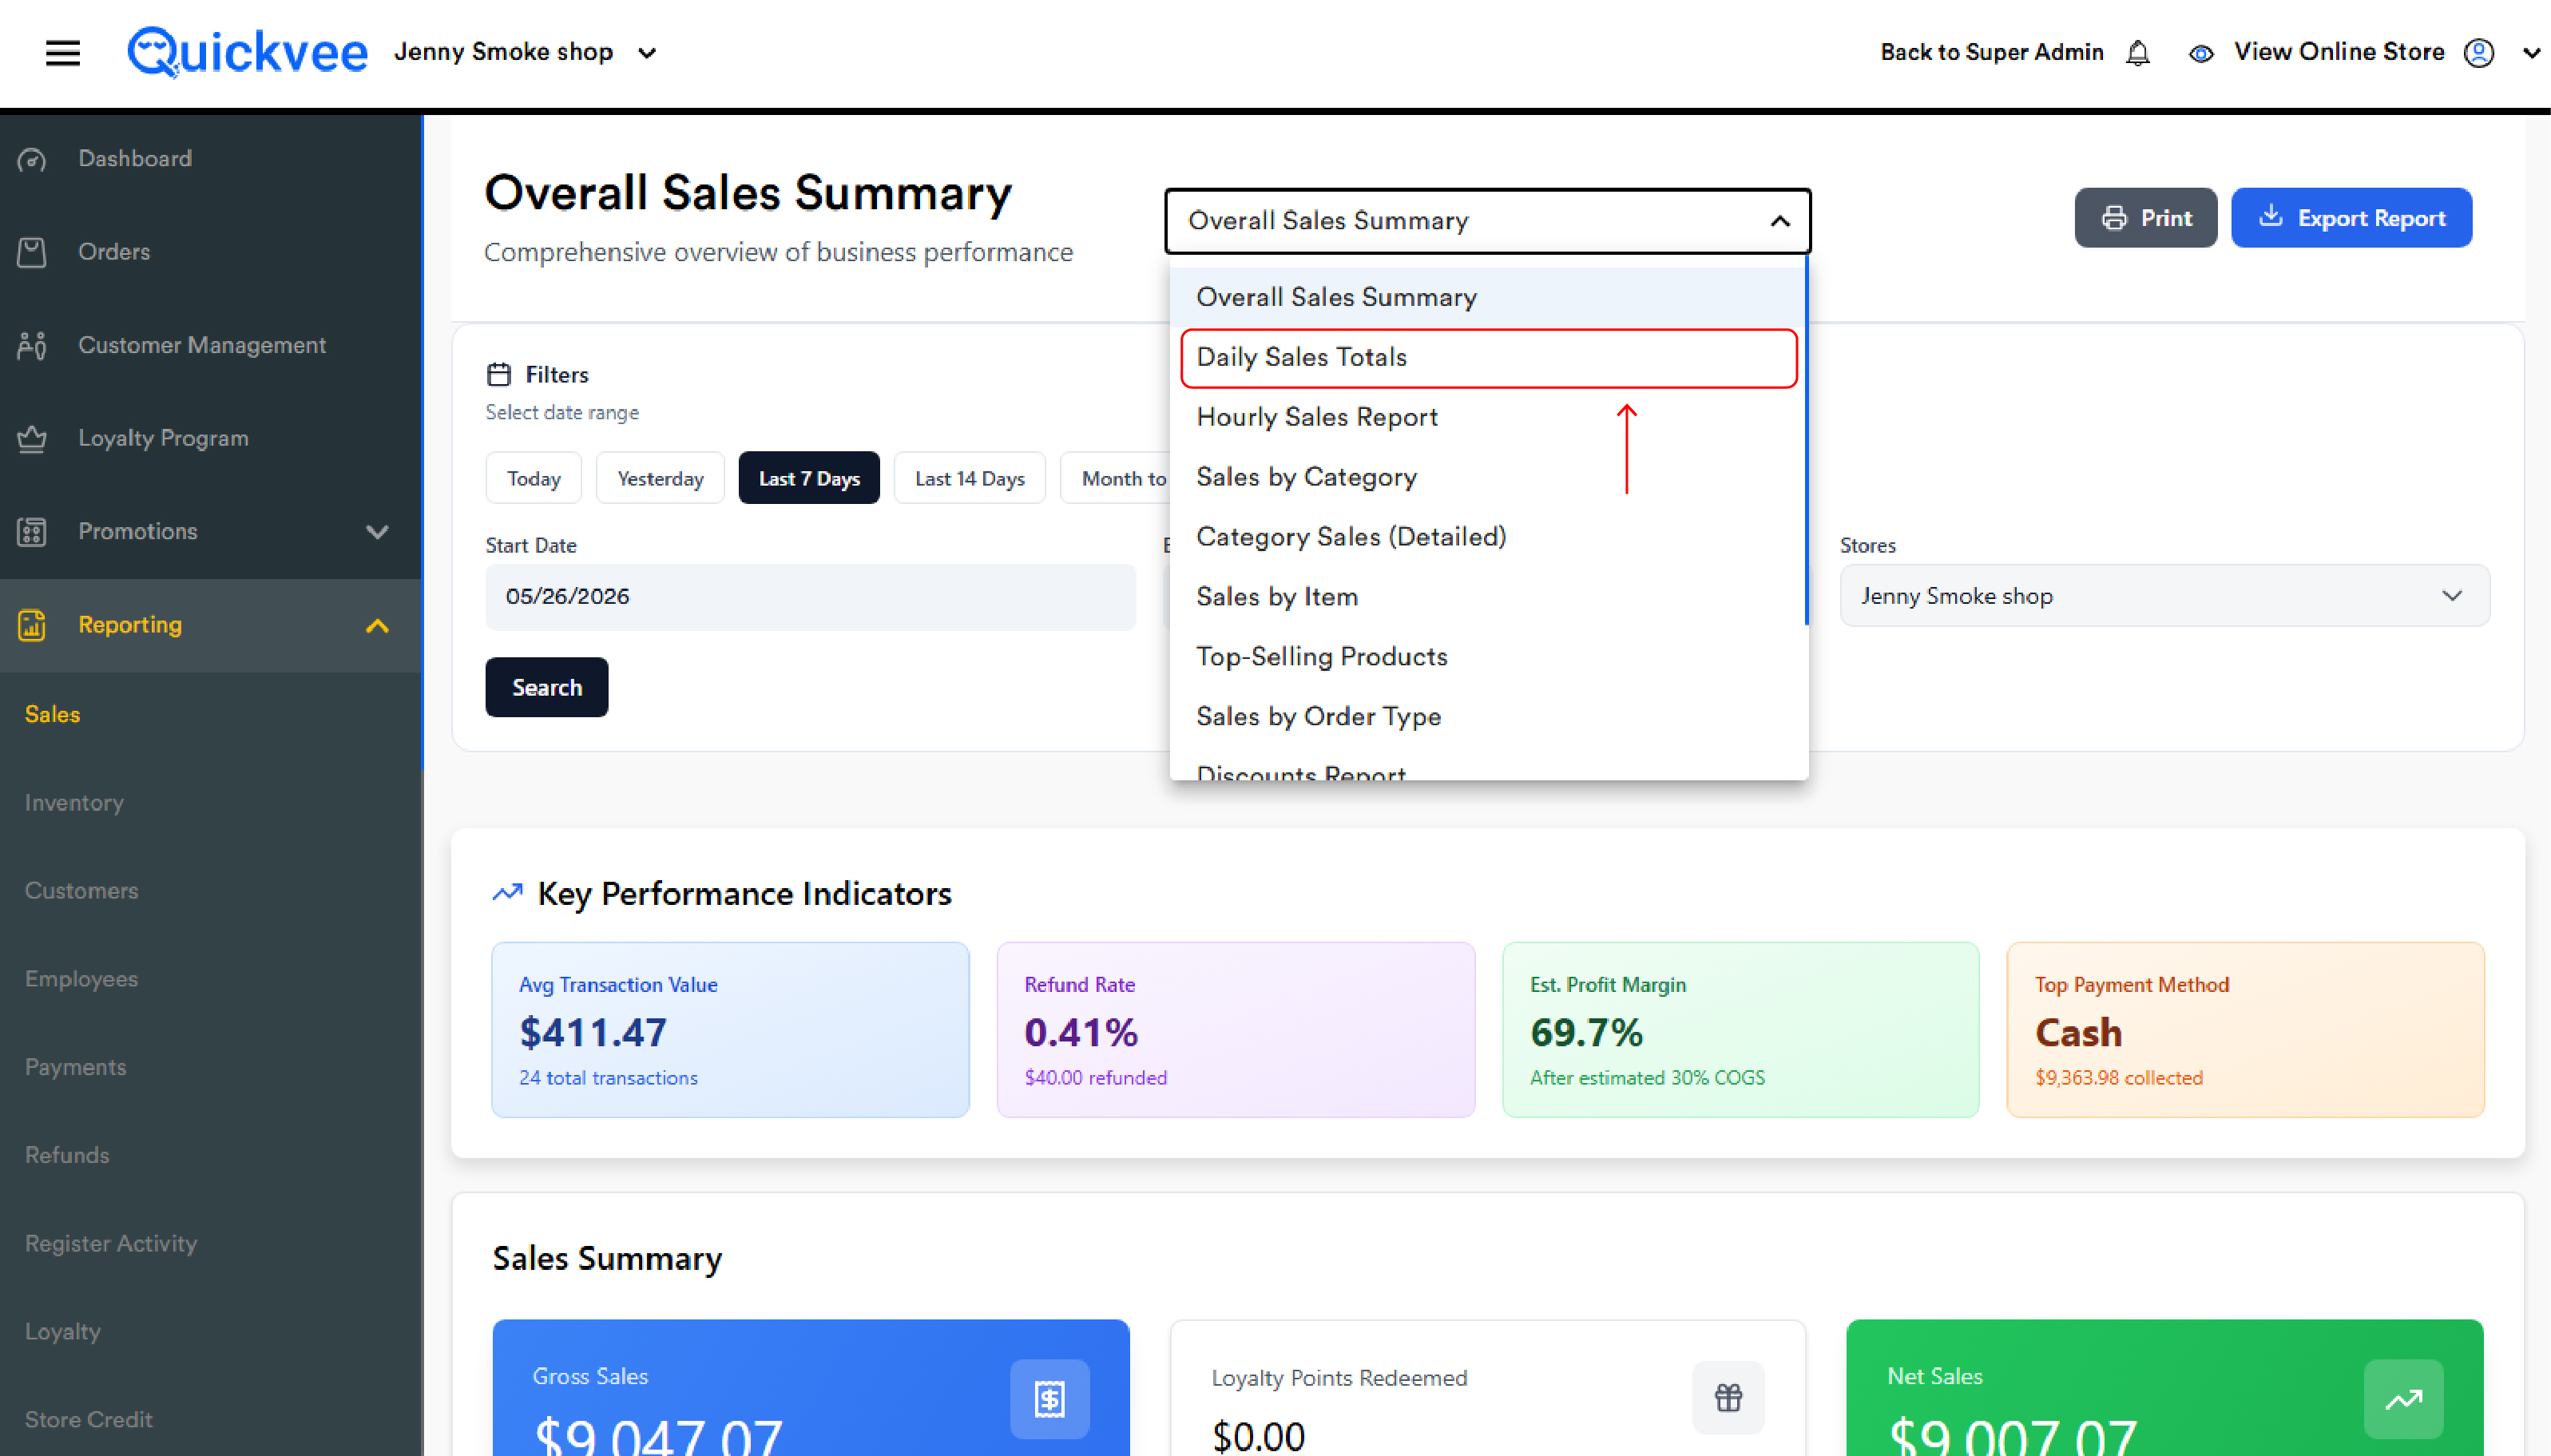
Access path: Quickvee Web → Reporting → Sales Reports → select Daily Sales Totals
The filter bar
Filters apply only after Search is tapped.
Date range
-
Quick filters — Today, Yesterday, Last 7 Days, Last 30 Days
-
Manual — pick a Start Date and End Date for any custom range
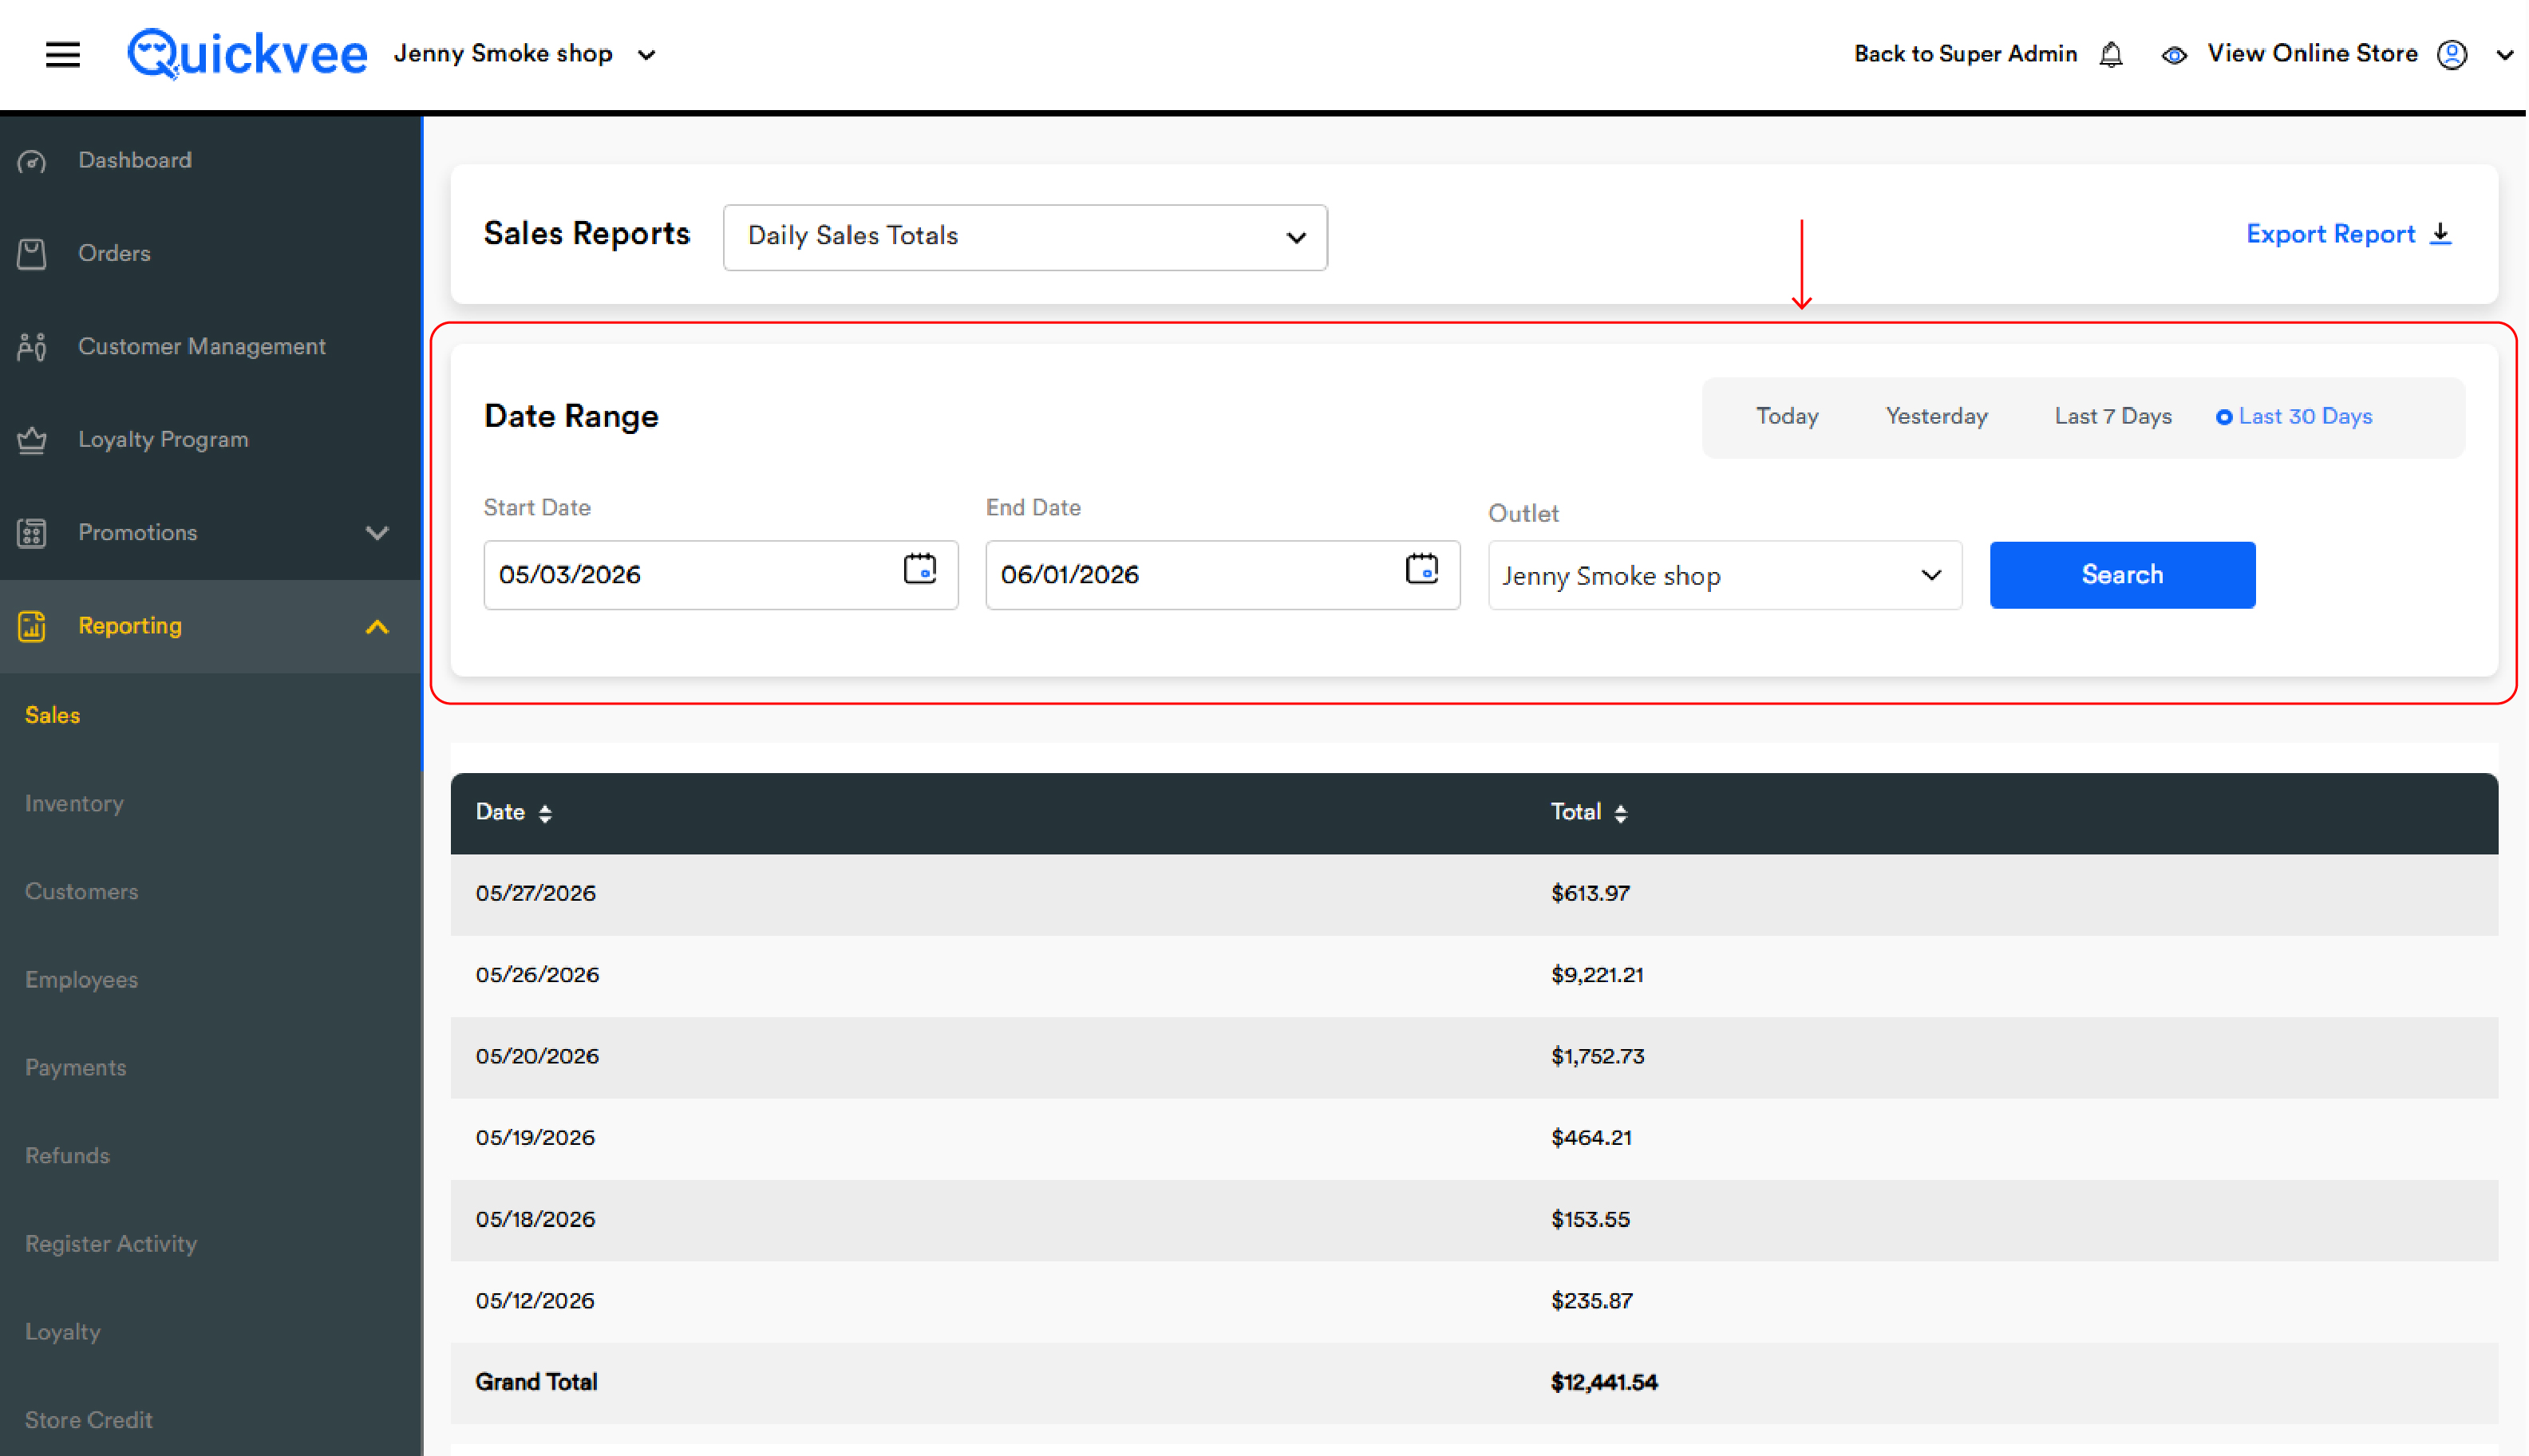
Unlike most other sales reports, Daily Sales Totals has no additional filter section — no category, no order type, no discount type. Every report is just days in range × total sales. This is intentional: the report is a single-number-per-day summary.
Outlet
For multi-store accounts, the Outlet dropdown selects which location to report on. To compare two stores, run the report twice and compare exports.
Search & Export
-
Search — applies the current filters and reloads the table
-
Export Report — downloads the current report. Particularly useful here since the simple two-column layout exports cleanly
Reading the table
|
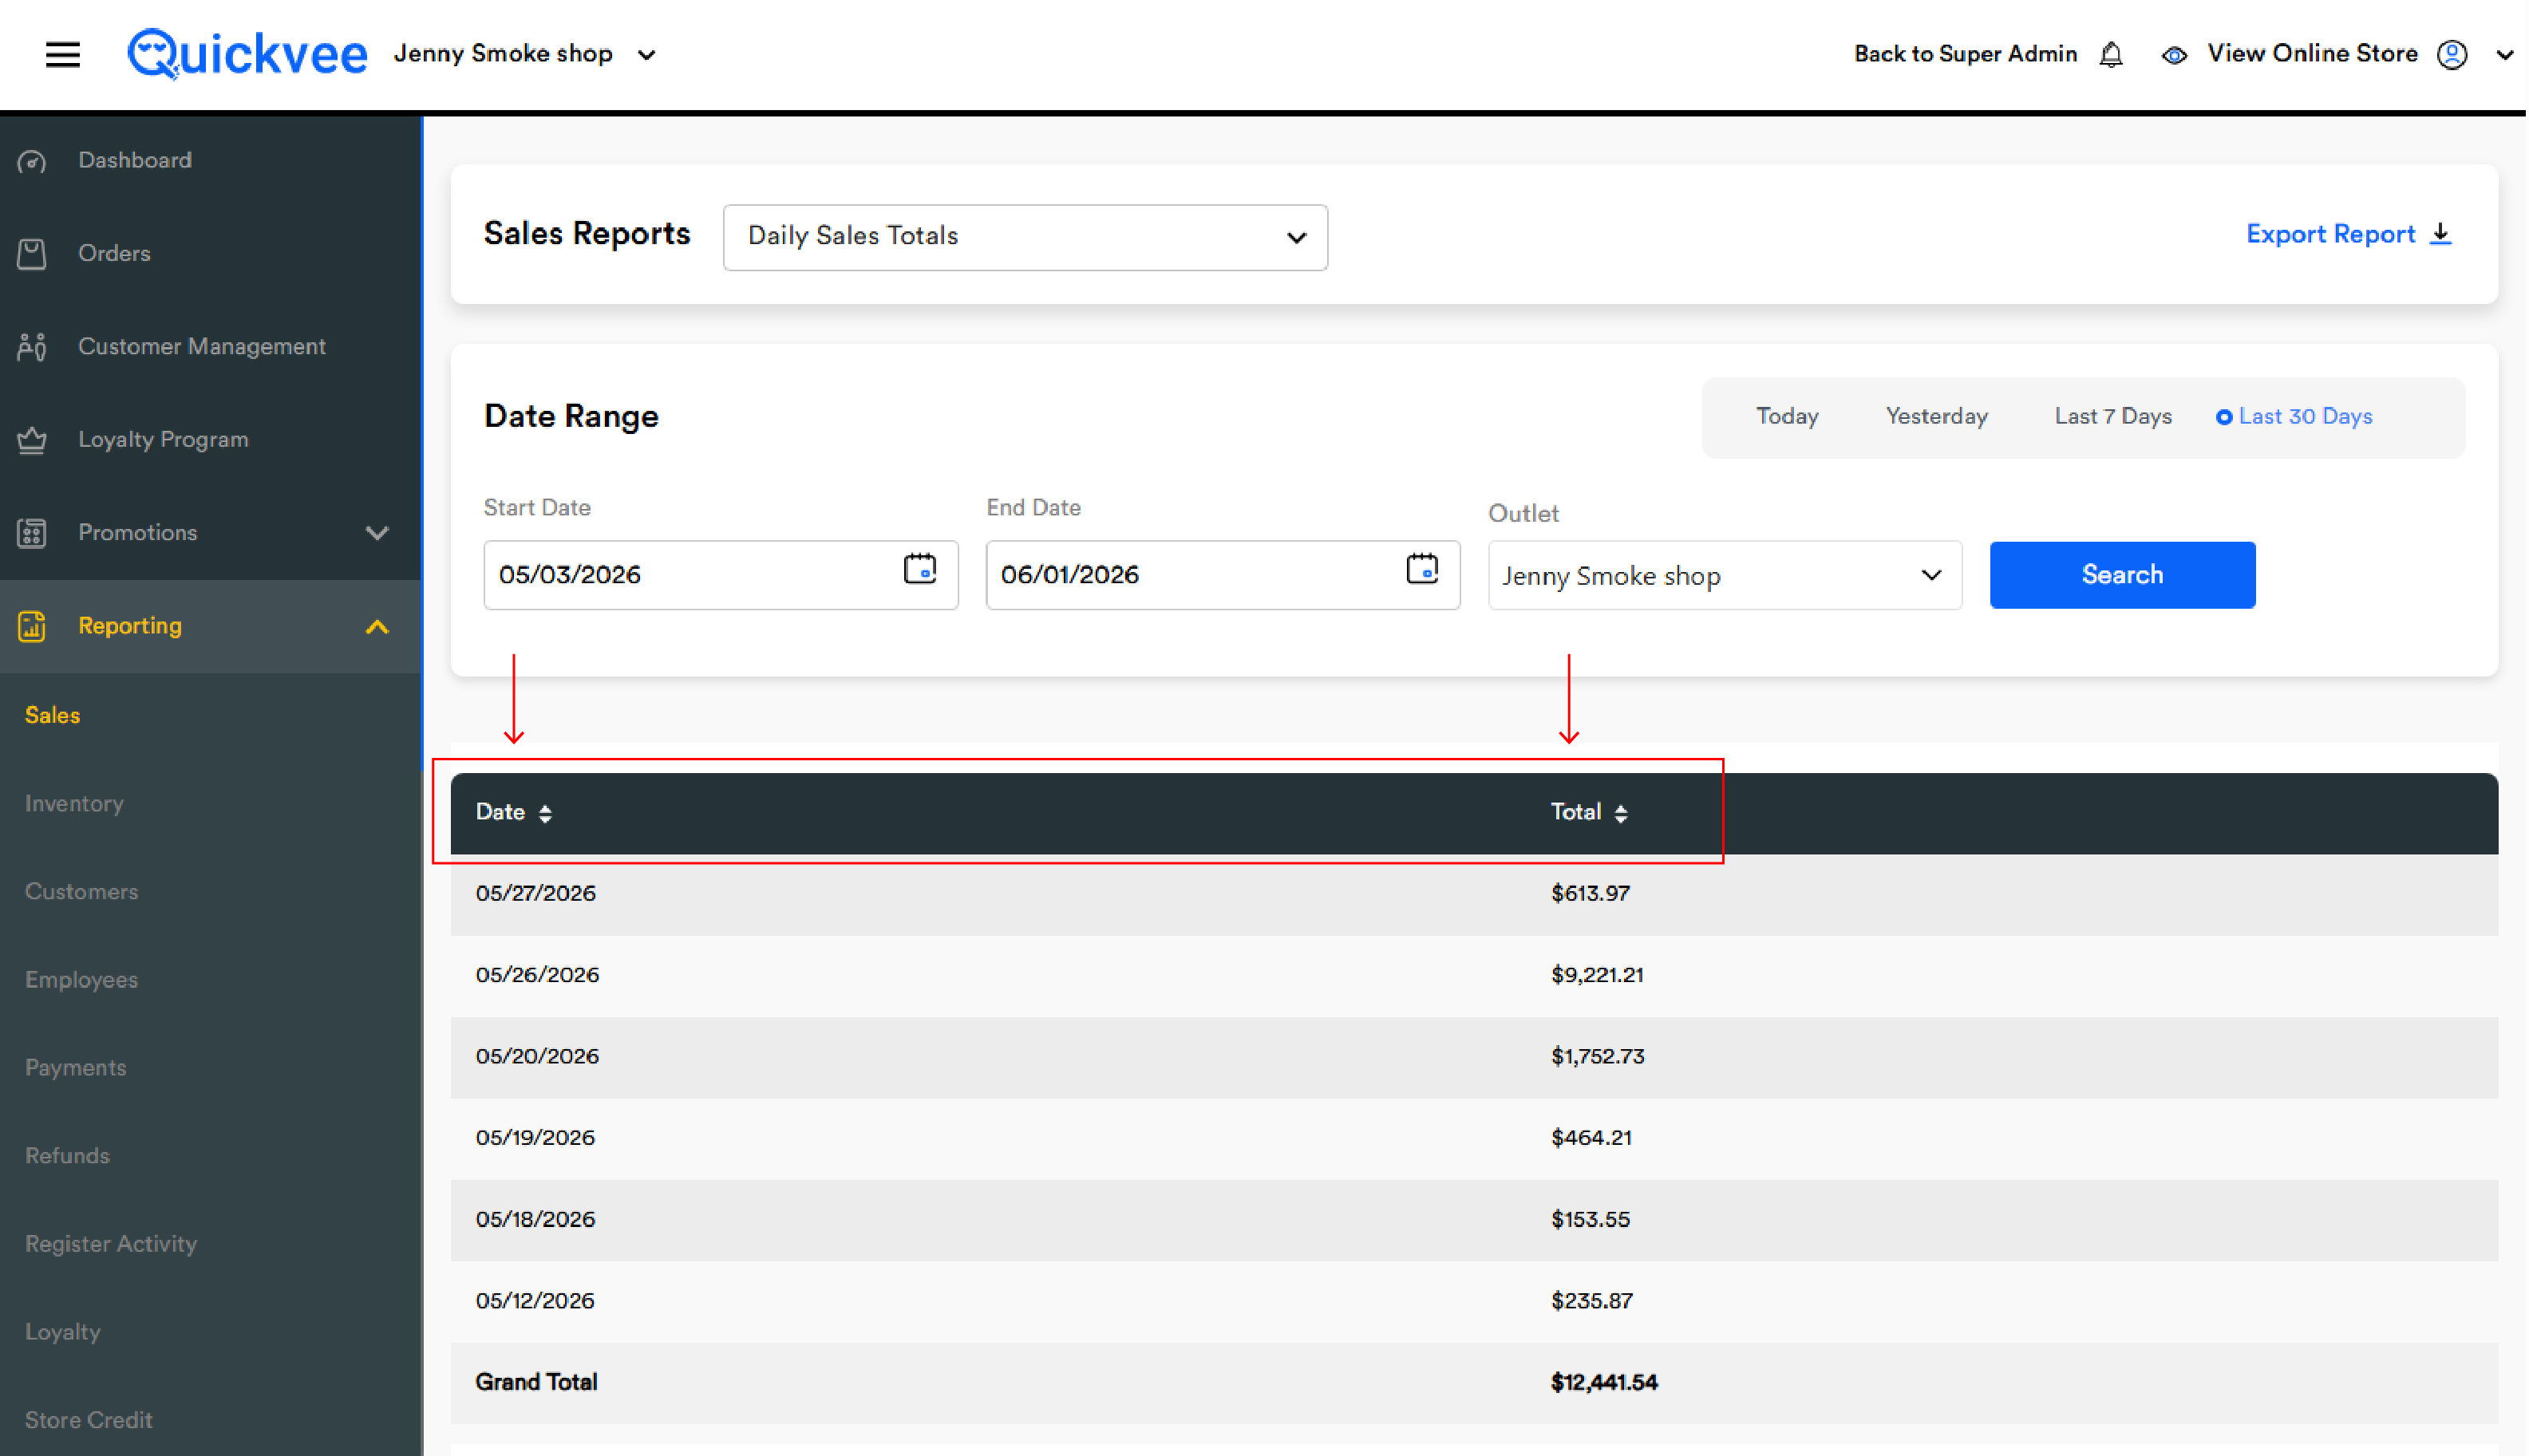
Column |
What it shows |
|---|---|
|
Date |
One row per calendar day in the selected range. Days with zero sales still appear if they fall inside the range, showing $0.00 |
|
Total |
The sum of all paid sales for that calendar day, net of refunds. This is gross of taxes — meaning what the customer paid that day, all-in |
Sorting
Both columns are sortable — tap a header to flip ascending/descending.
-
Date descending (default) puts the most recent day at the top — natural for end-of-day reconciliation
-
Date ascending puts the oldest day at the top — useful when reading a trend left-to-right
-
Total descending ranks the days by revenue, surfacing your best day in the range at the top
-
Total ascending surfaces the slowest days first — useful for finding weak days to target with promotions
The Grand Total
The bottom row of the table is Grand Total — the sum of every day in the table. This is the single most important number on the report: it's the merchant's gross revenue for the entire date range, comparable directly with the dashboard, the Sales by Order Type report, and the daily till closeout totals.
Common workflows
"Show me last week"
Quick filter → Last 7 Days → Search. Read the Grand Total at the bottom. That's last week's gross revenue in one number.
"Find my best day of the month"
Quick filter → Last 30 Days → Search. Sort by Total descending. The top row is your single best day.
"How does this week compare to last week?"
Run the report for Last 7 Days, note the Grand Total. Manually set Start Date and End Date to the 7-day window before that, run the report again. The difference is your week-over-week change in gross sales.
"Reconcile end-of-day cash"
Quick filter → Today (or Yesterday at end-of-day) → Search. Compare the single-day Total against the day's register close-out from the POS. They should match. If they don't, drill into Sales by Order Type, Refunds, or Payments reports.
"Find slow days for a promo target"
Run the report for the past Last 30 Days, sort Total ascending. The top of the sorted view is your softest revenue days. Cross-reference these against the day of week to spot a pattern (e.g. Tuesdays consistently low) and plan a Tuesday-only promotion.
Important notes
The total is gross of tax, net of refunds. Each day's Total includes the tax the customer paid; it does not exclude tax. Refunds processed on that day reduce that day's total — a refund of yesterday's order processed today reduces today's Total, not yesterday's.
Cancelled orders are excluded. Orders that were created but cancelled before payment do not contribute to the total. Held orders that are paid later contribute to the day they are paid, not the day they were created.
Both In-Store and Online orders are included. A day's Total combines POS sales, online pickup orders, and online delivery orders. To split these out by channel, use the Sales by Order Type report.
Days with zero sales are shown. If a store was closed on a Sunday and the range includes that Sunday, the row appears with $0.00.
Filters do not auto-apply. Changing the date range or outlet requires tapping Search.
Sort order persists between Searches. If you sort by Total and then change the date range and tap Search, the new report keeps Total sorting. Re-tap the Date column header to return to chronological order.