
🚧 Draft article — source ticket MM-507 is still in To Do.
The Sales by Category report rolls every paid line item up to its product category and reports — for each category — how many units sold, what the gross sales were, what the items cost, how much was discounted, the net sales, and the resulting gross margin and gross profit. It's the closest thing to a P&L view inside Sales Reports: not just what each category brought in, but what each category actually earned.
Access path: Quickvee Web → Reporting → Sales Reports → select Sales by Category
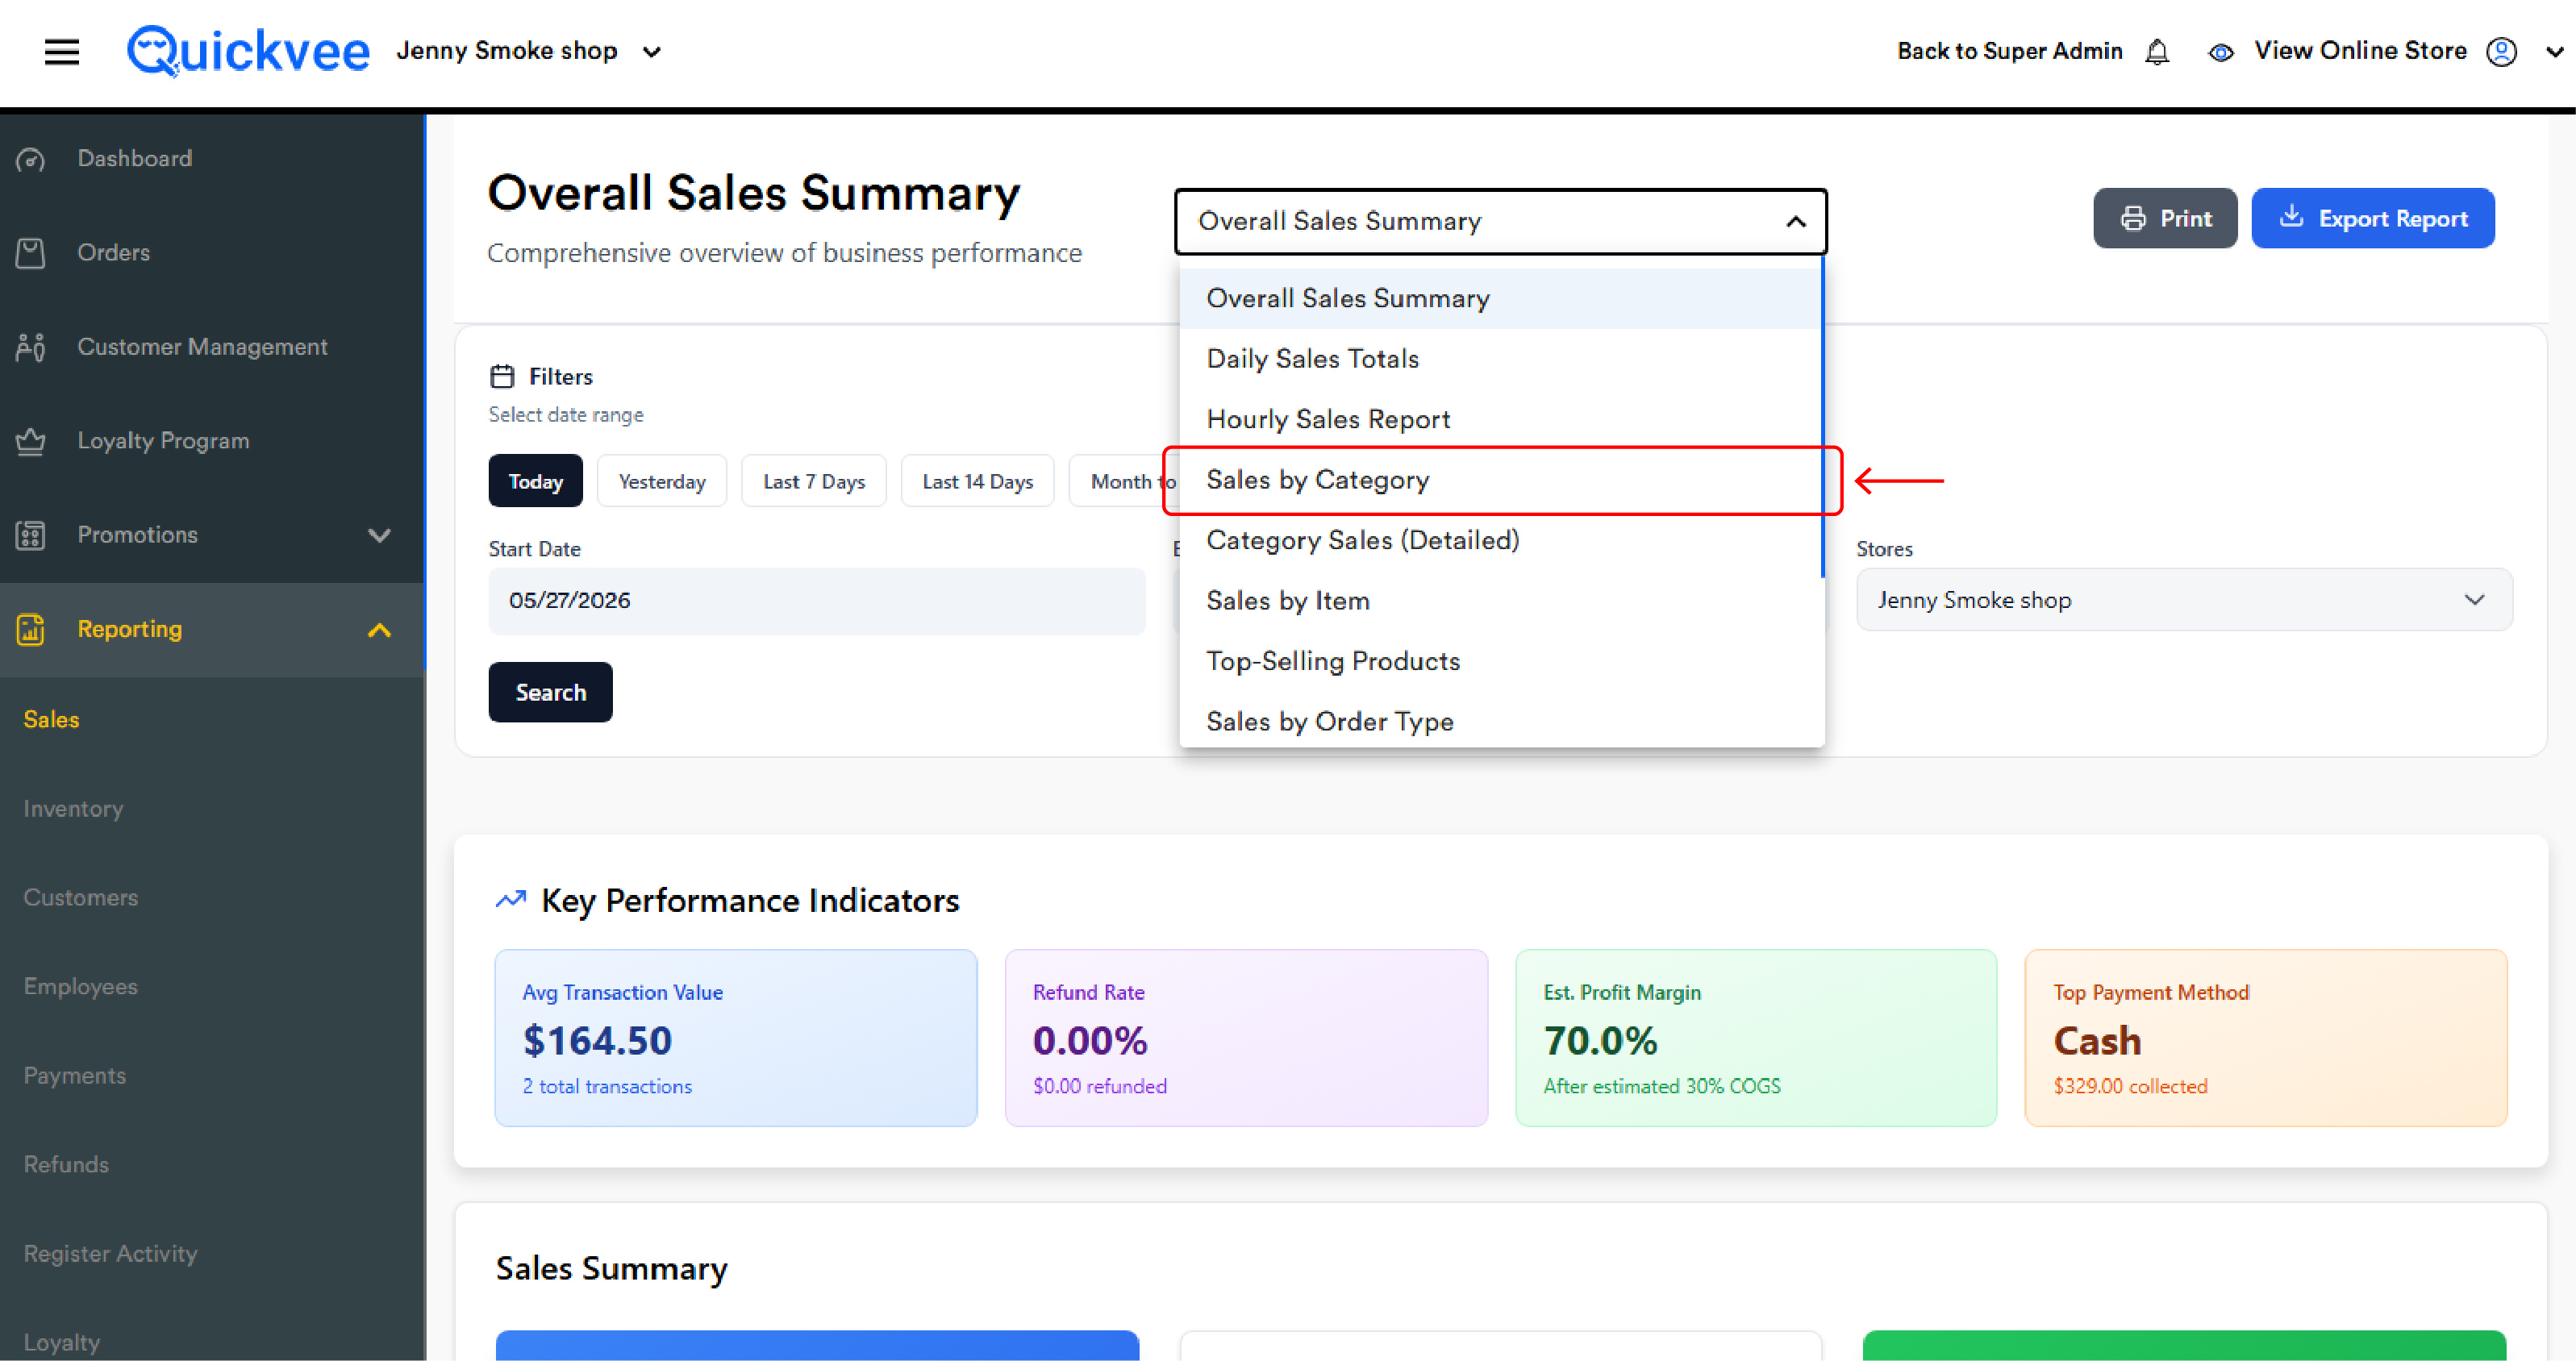
Use it to find your most profitable categories, your least profitable categories, and the categories where heavy discounting is eating margin.
The filter bar
Filter By — Category
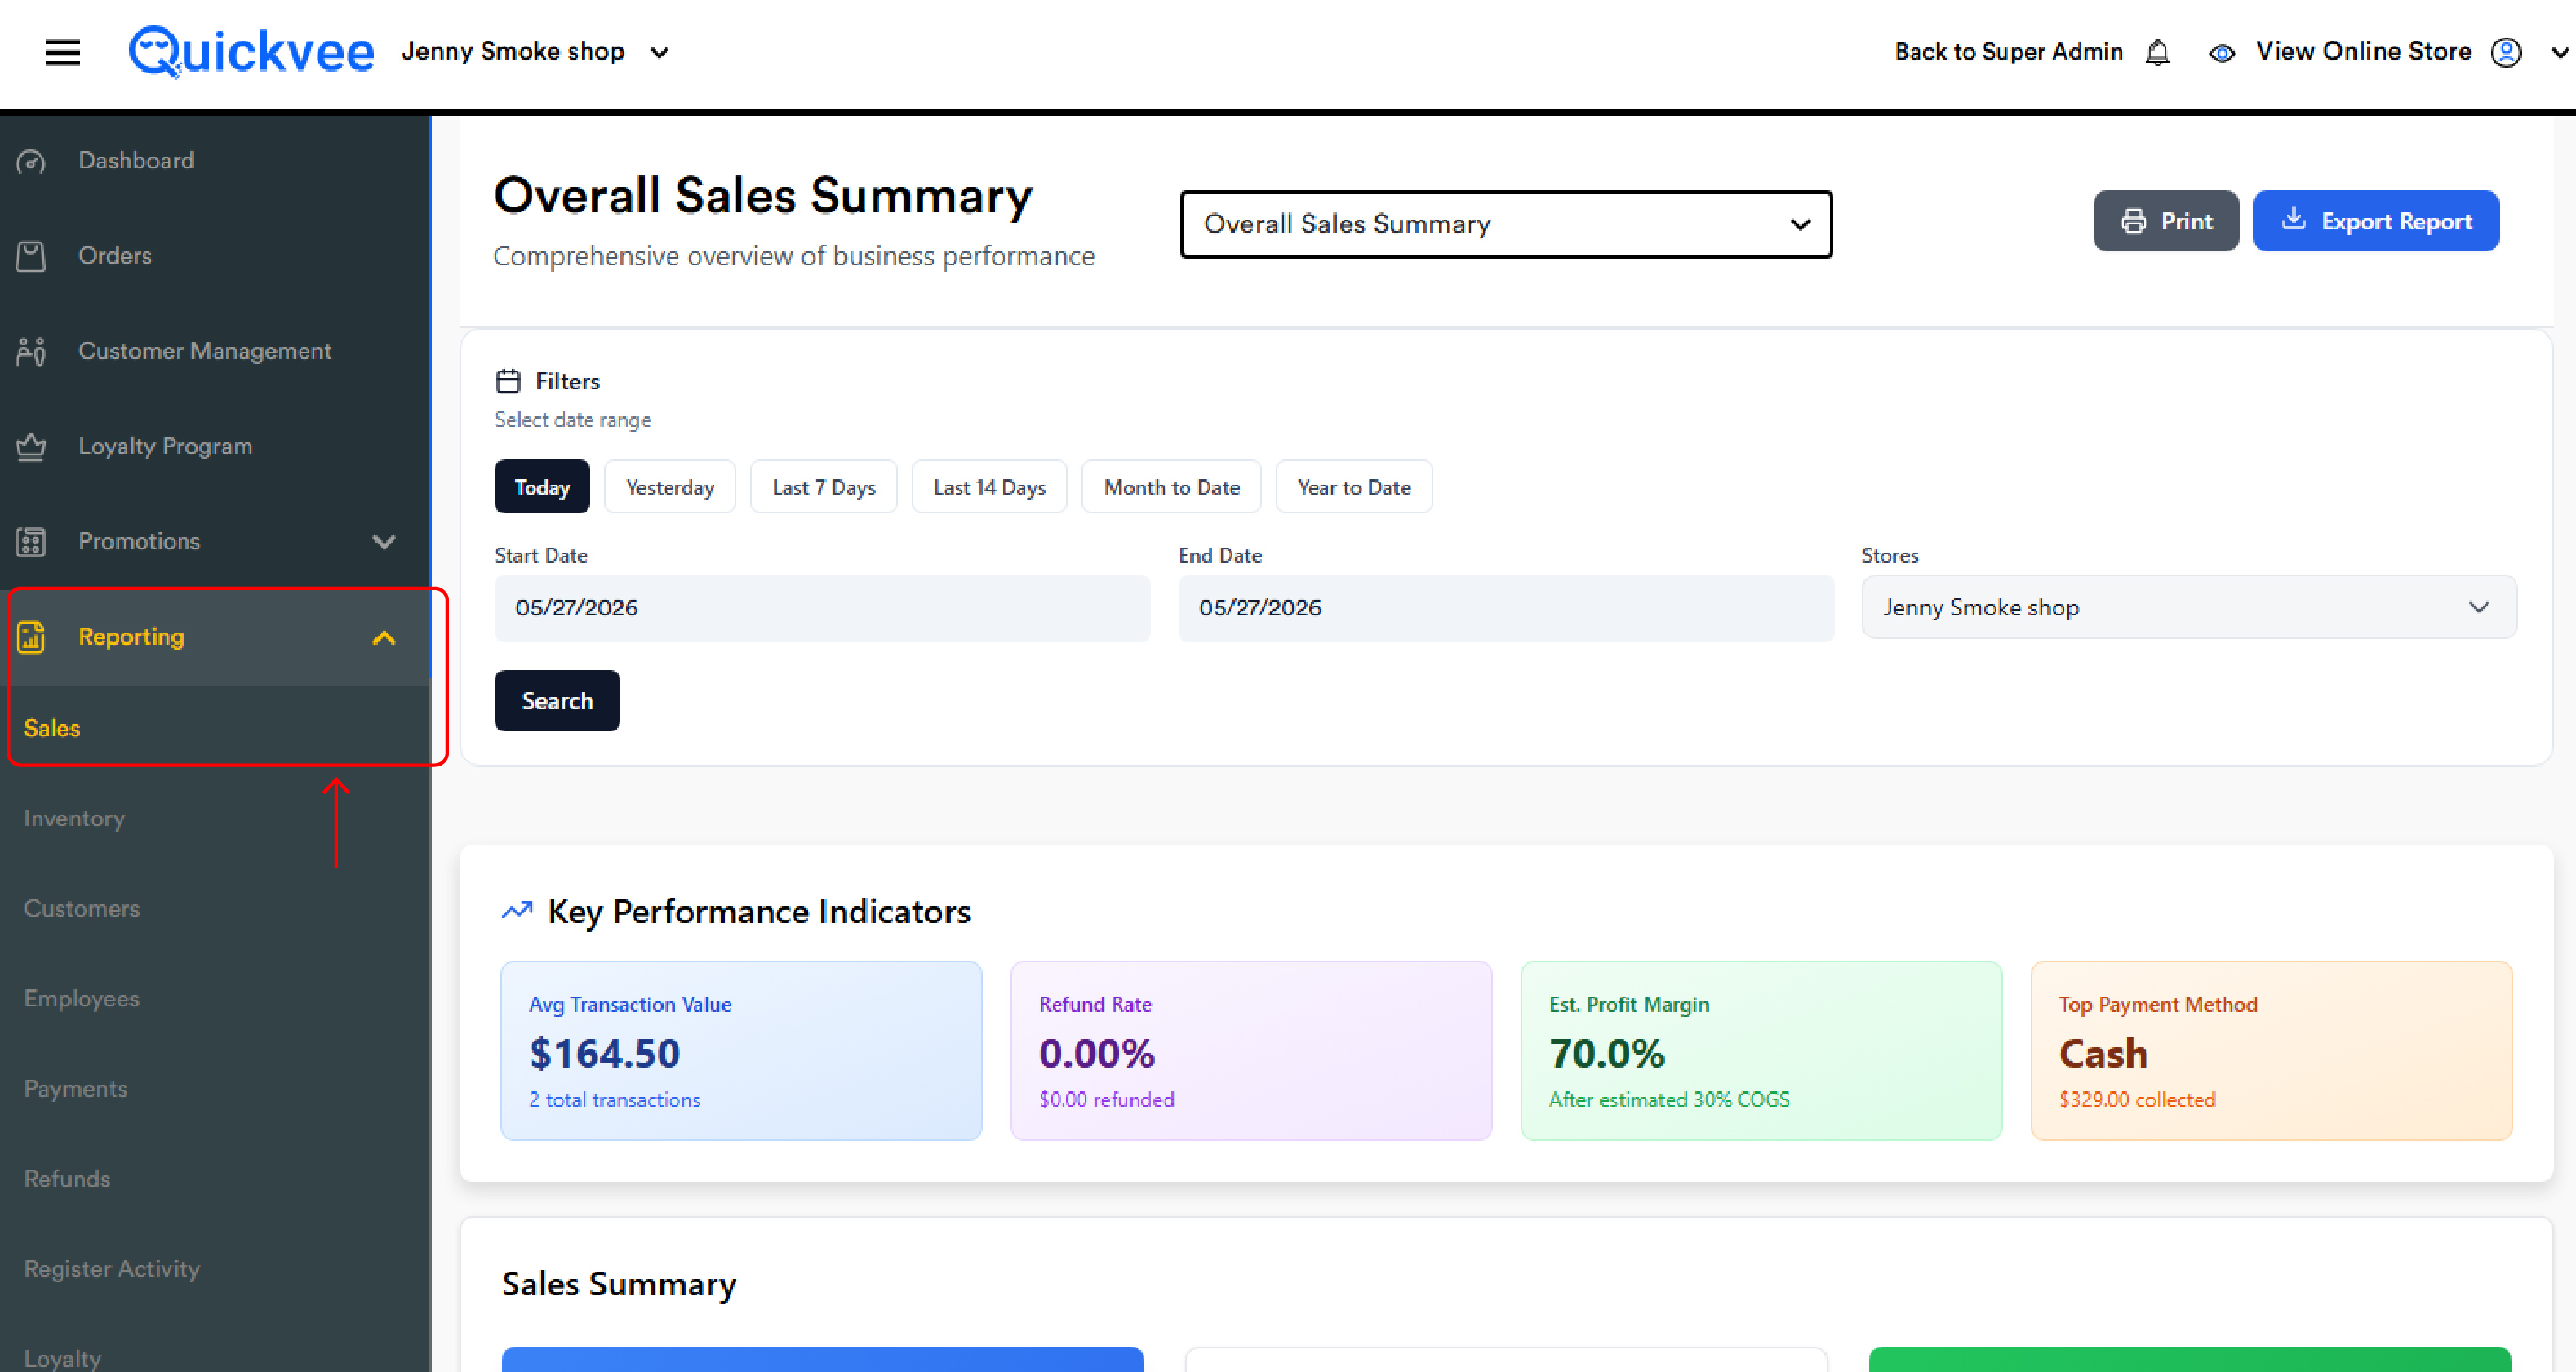
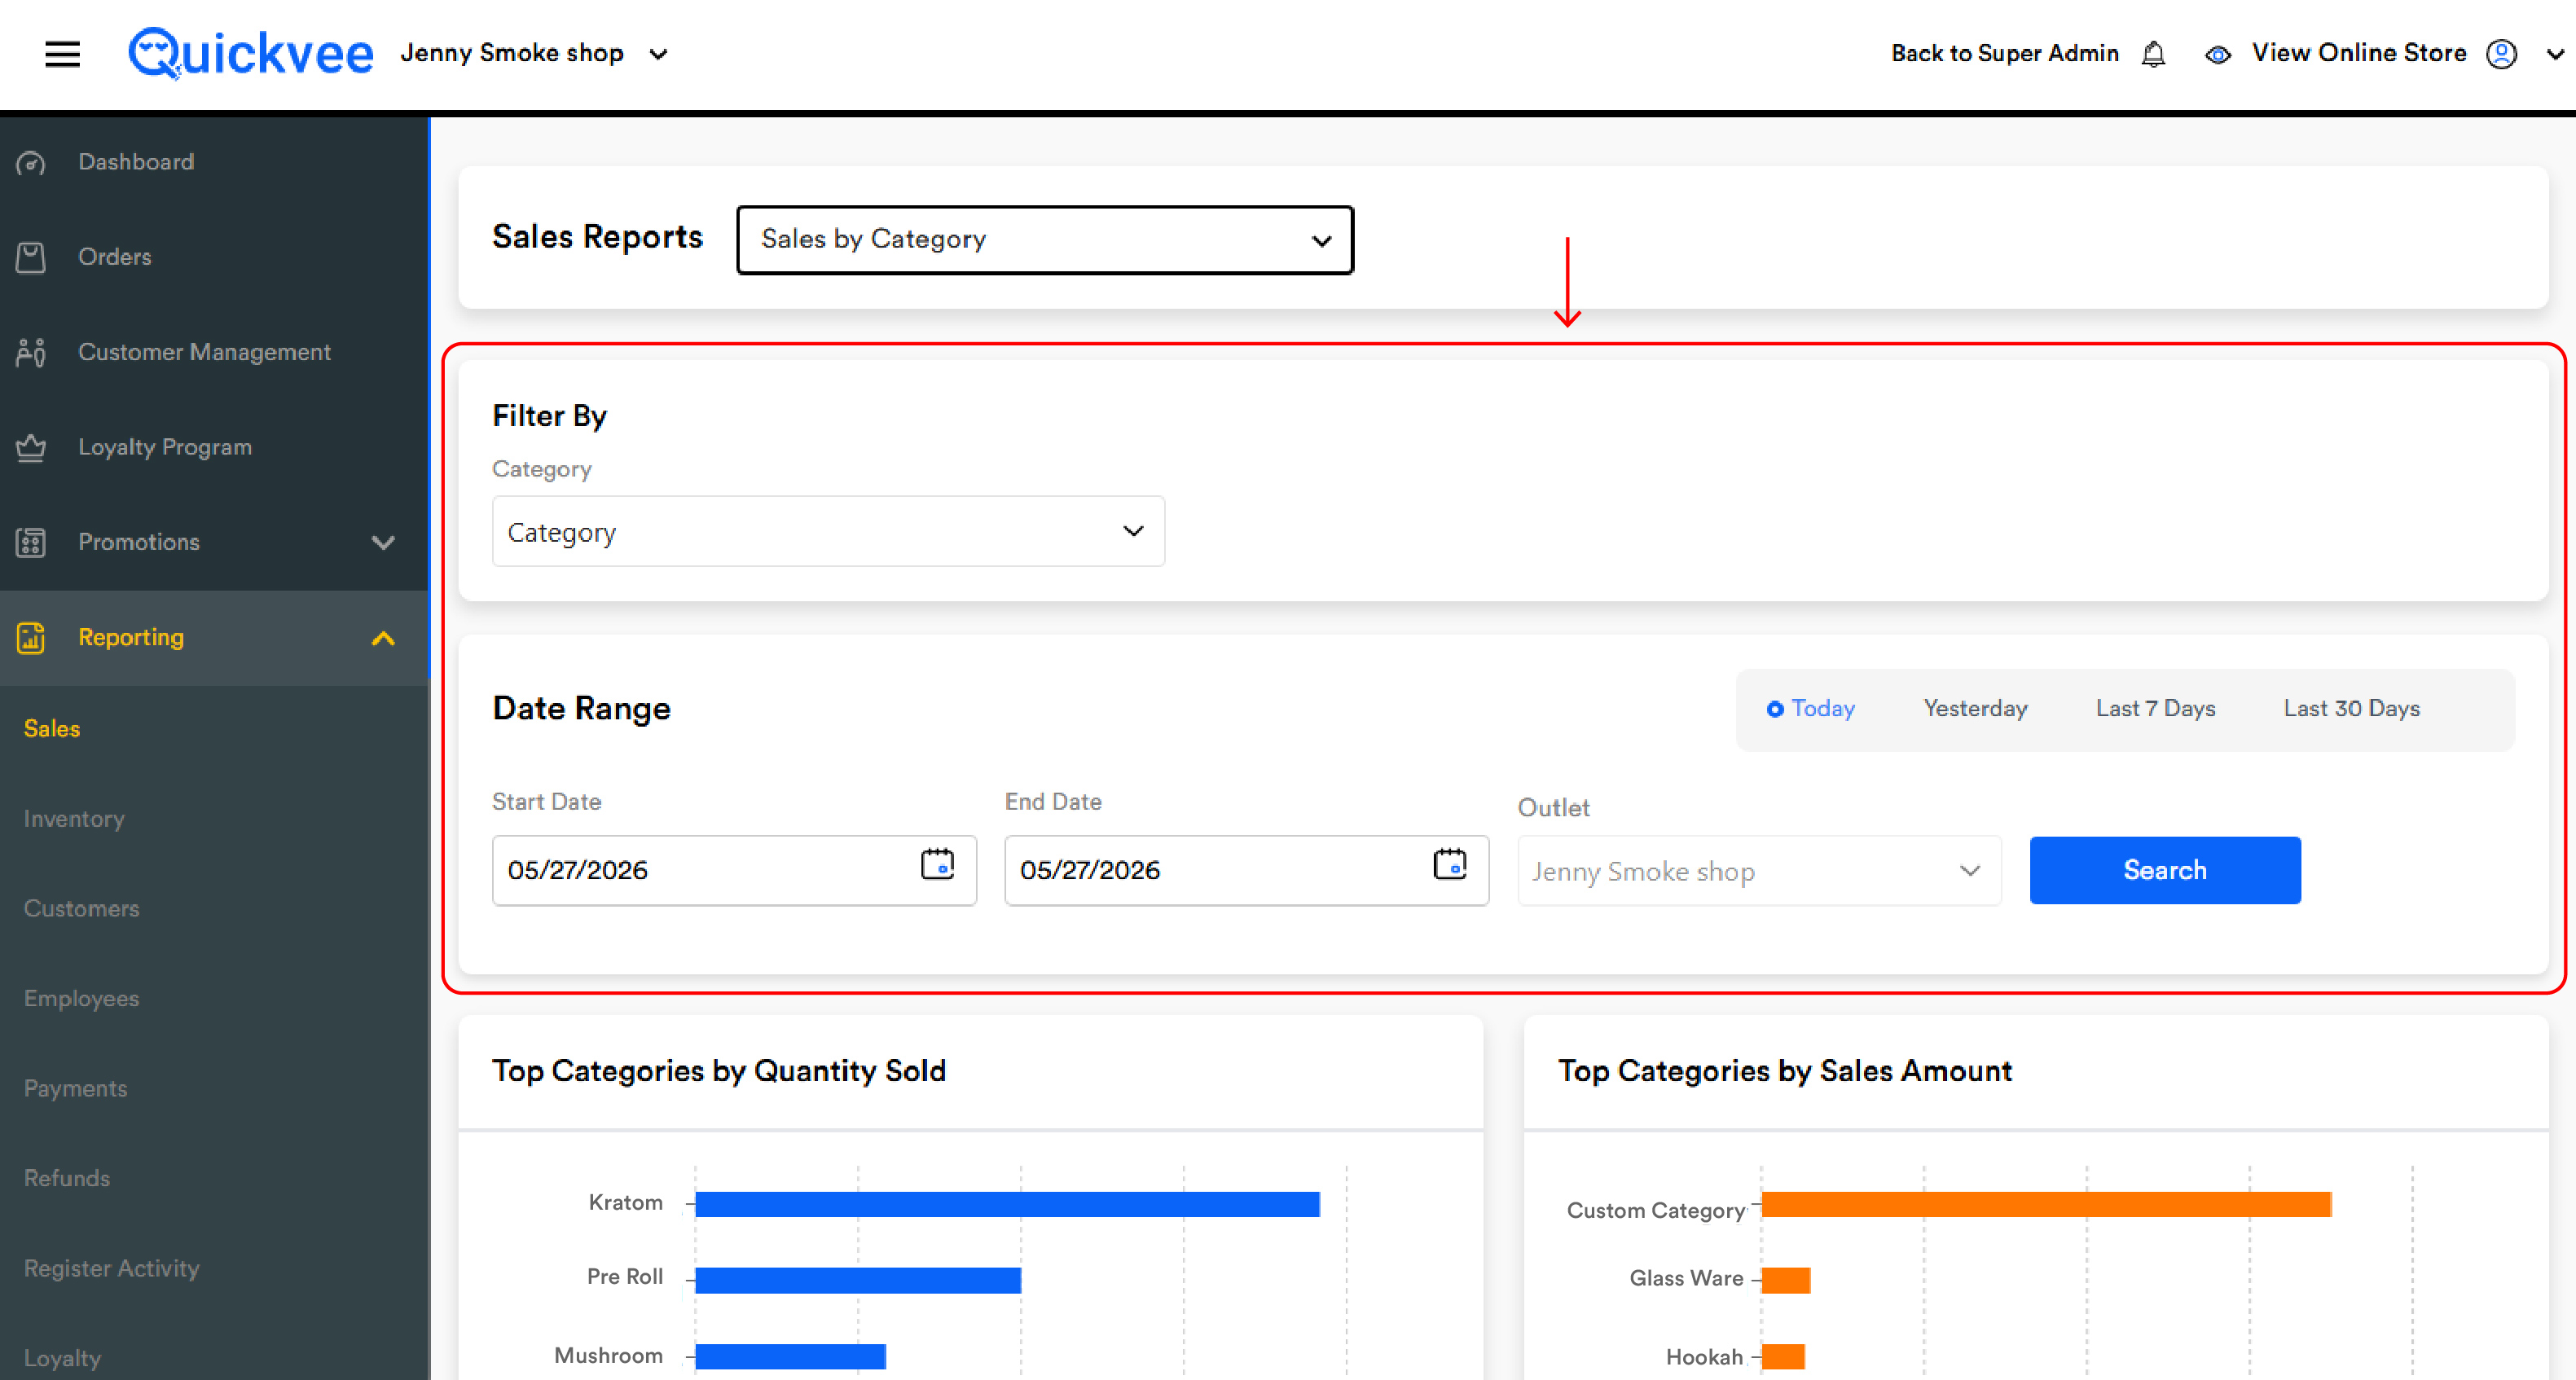
A multi-select Category dropdown narrows the report to one or several specific categories. Default returns every category that recorded activity. Selecting one or a handful is useful when investigating a specific group or comparing competing categories.
Date range
-
Quick filters — Today, Yesterday, Last 7 Days, Last 30 Days
-
Manual — Start Date / End Date pickers
Outlet
For multi-store accounts, the Outlet dropdown selects which location.
Search & Export
-
Search — applies filters and reloads every section
-
Export Report — downloads for sharing or Excel. Especially useful since the table benefits from spreadsheet sorting
Reading the charts
Two side-by-side horizontal bar charts give a quick visual comparison before the detailed table.
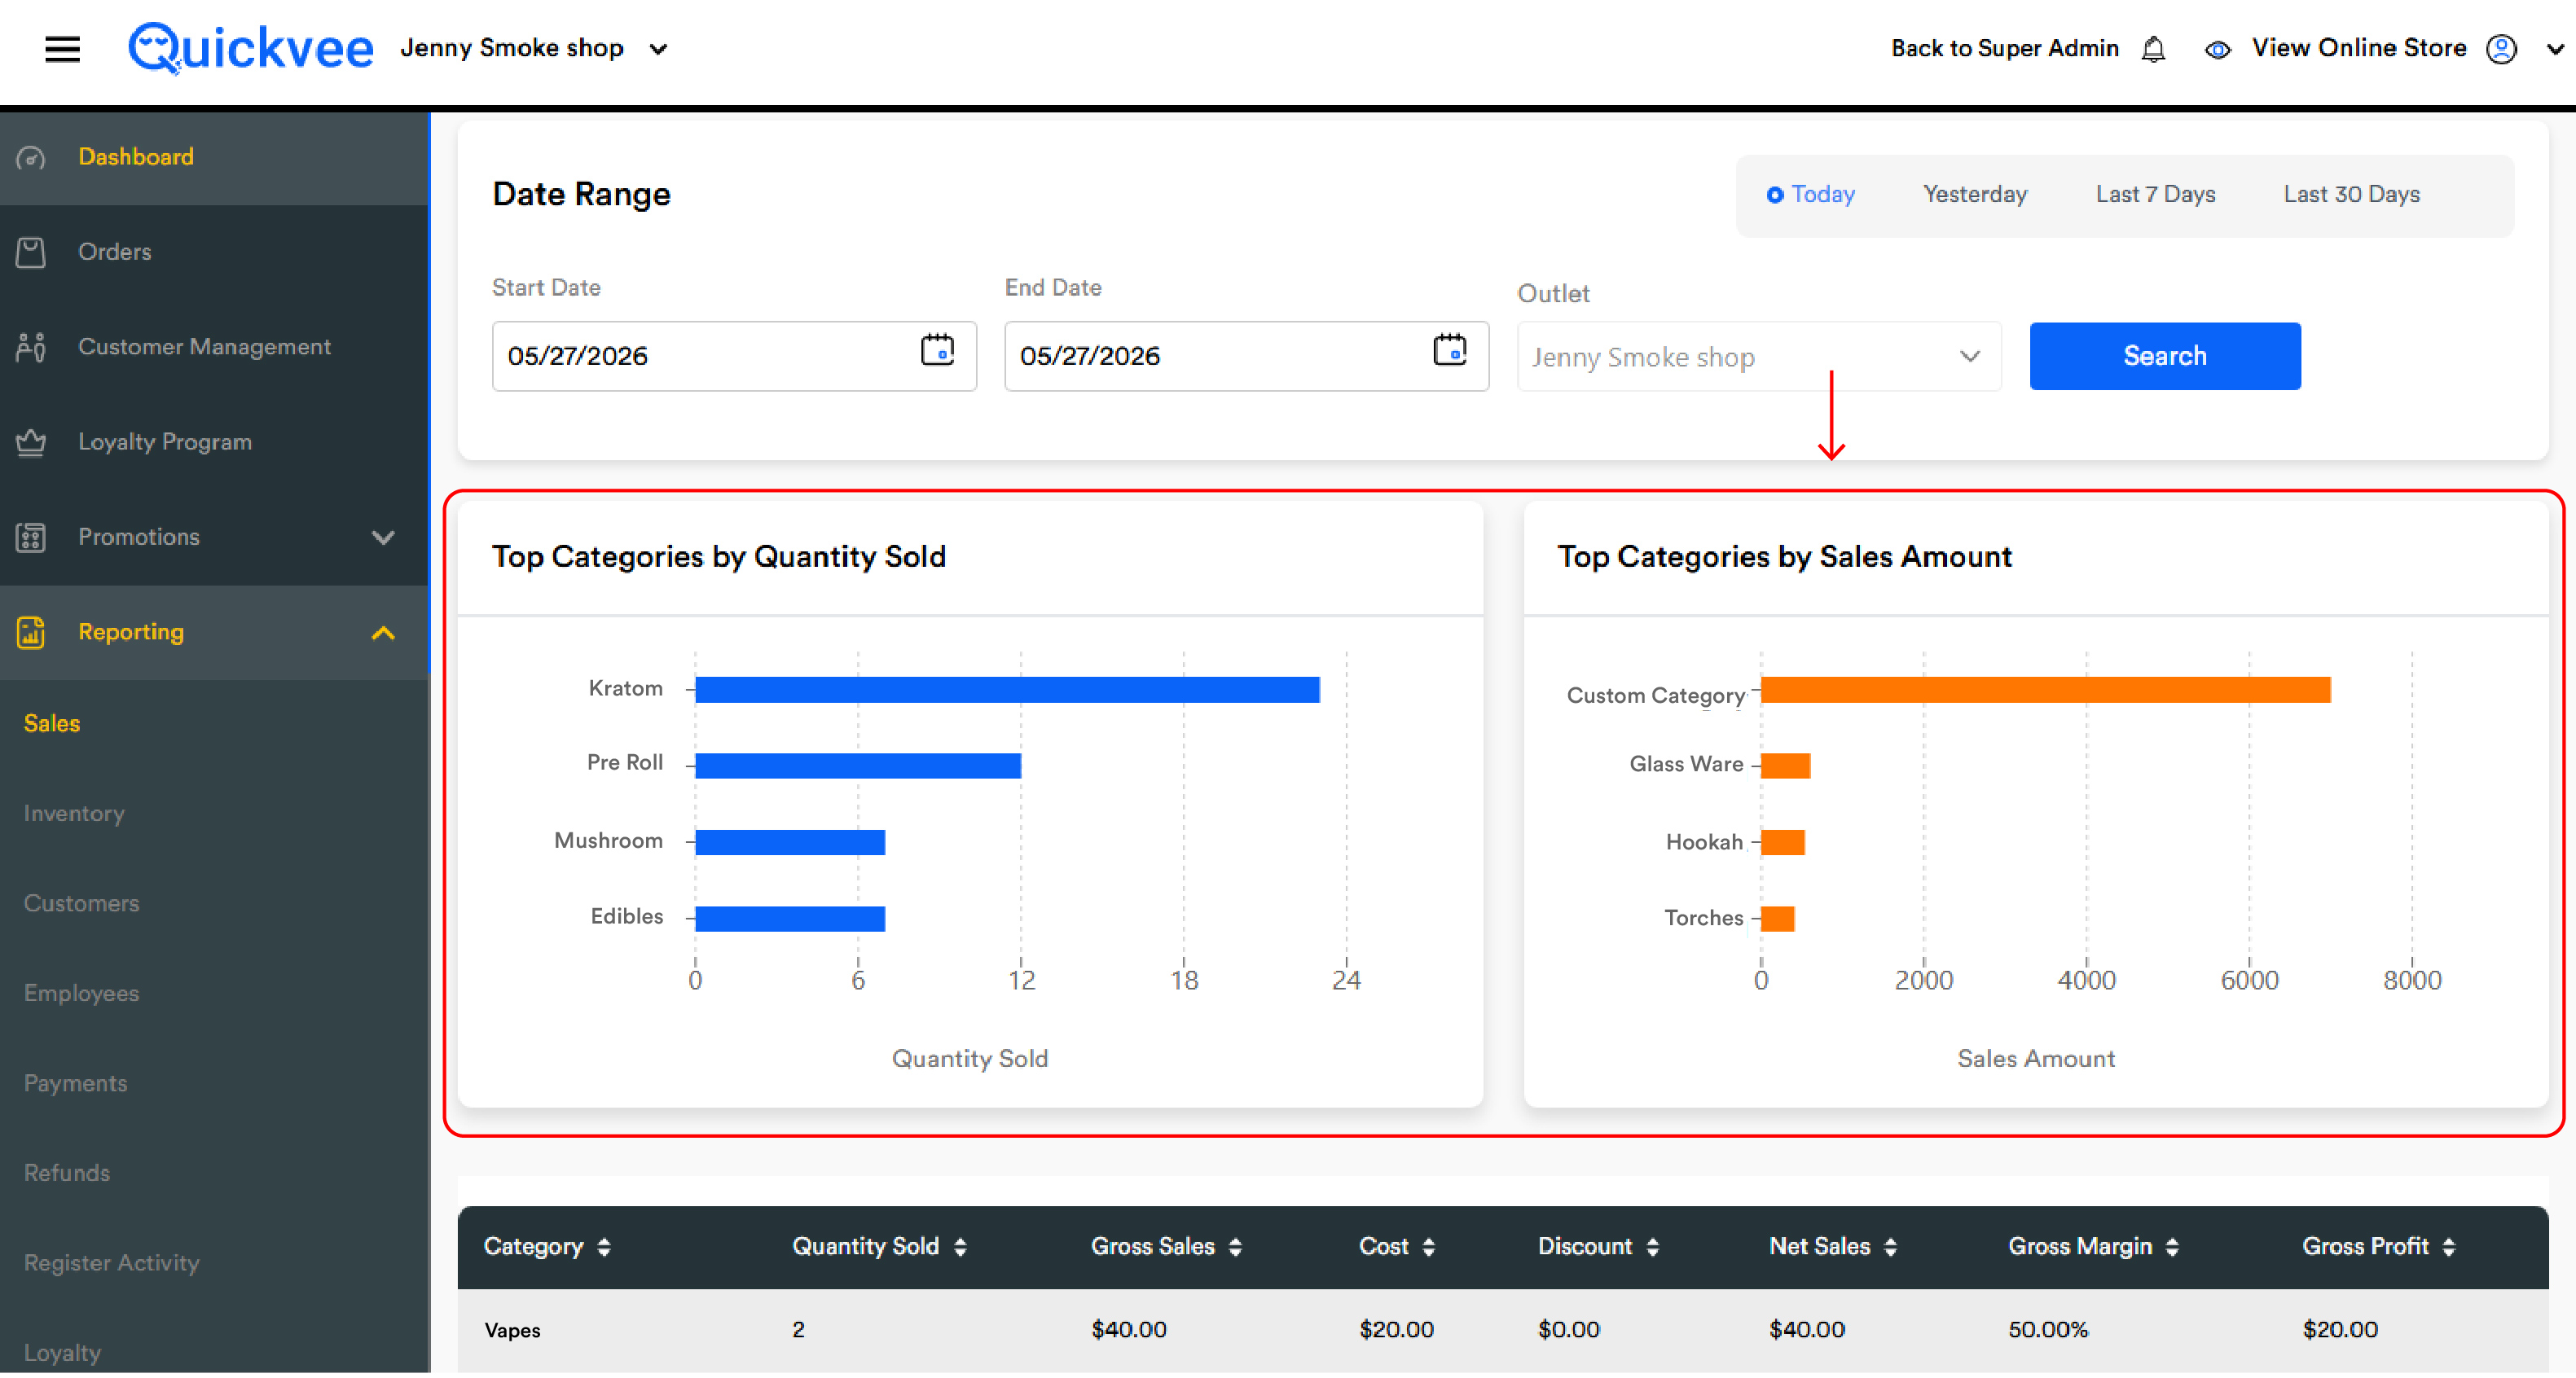
Top Categories by Quantity Sold
Ranks categories by unit volume. The longest bar is the category whose products move the most units, regardless of price. Answers: "Which category are customers reaching for most often?"
Top Categories by Sales Amount
Ranks categories by dollar revenue. The longest bar is the category that contributed the most to revenue, regardless of unit volume. Answers: "Which category brings in the most money?"
The two charts often disagree, and that disagreement is the insight. A category can dominate volume (cheap, fast-moving) without dominating revenue, or dominate revenue (premium, slow-moving) without dominating volume.
Reading the detail table
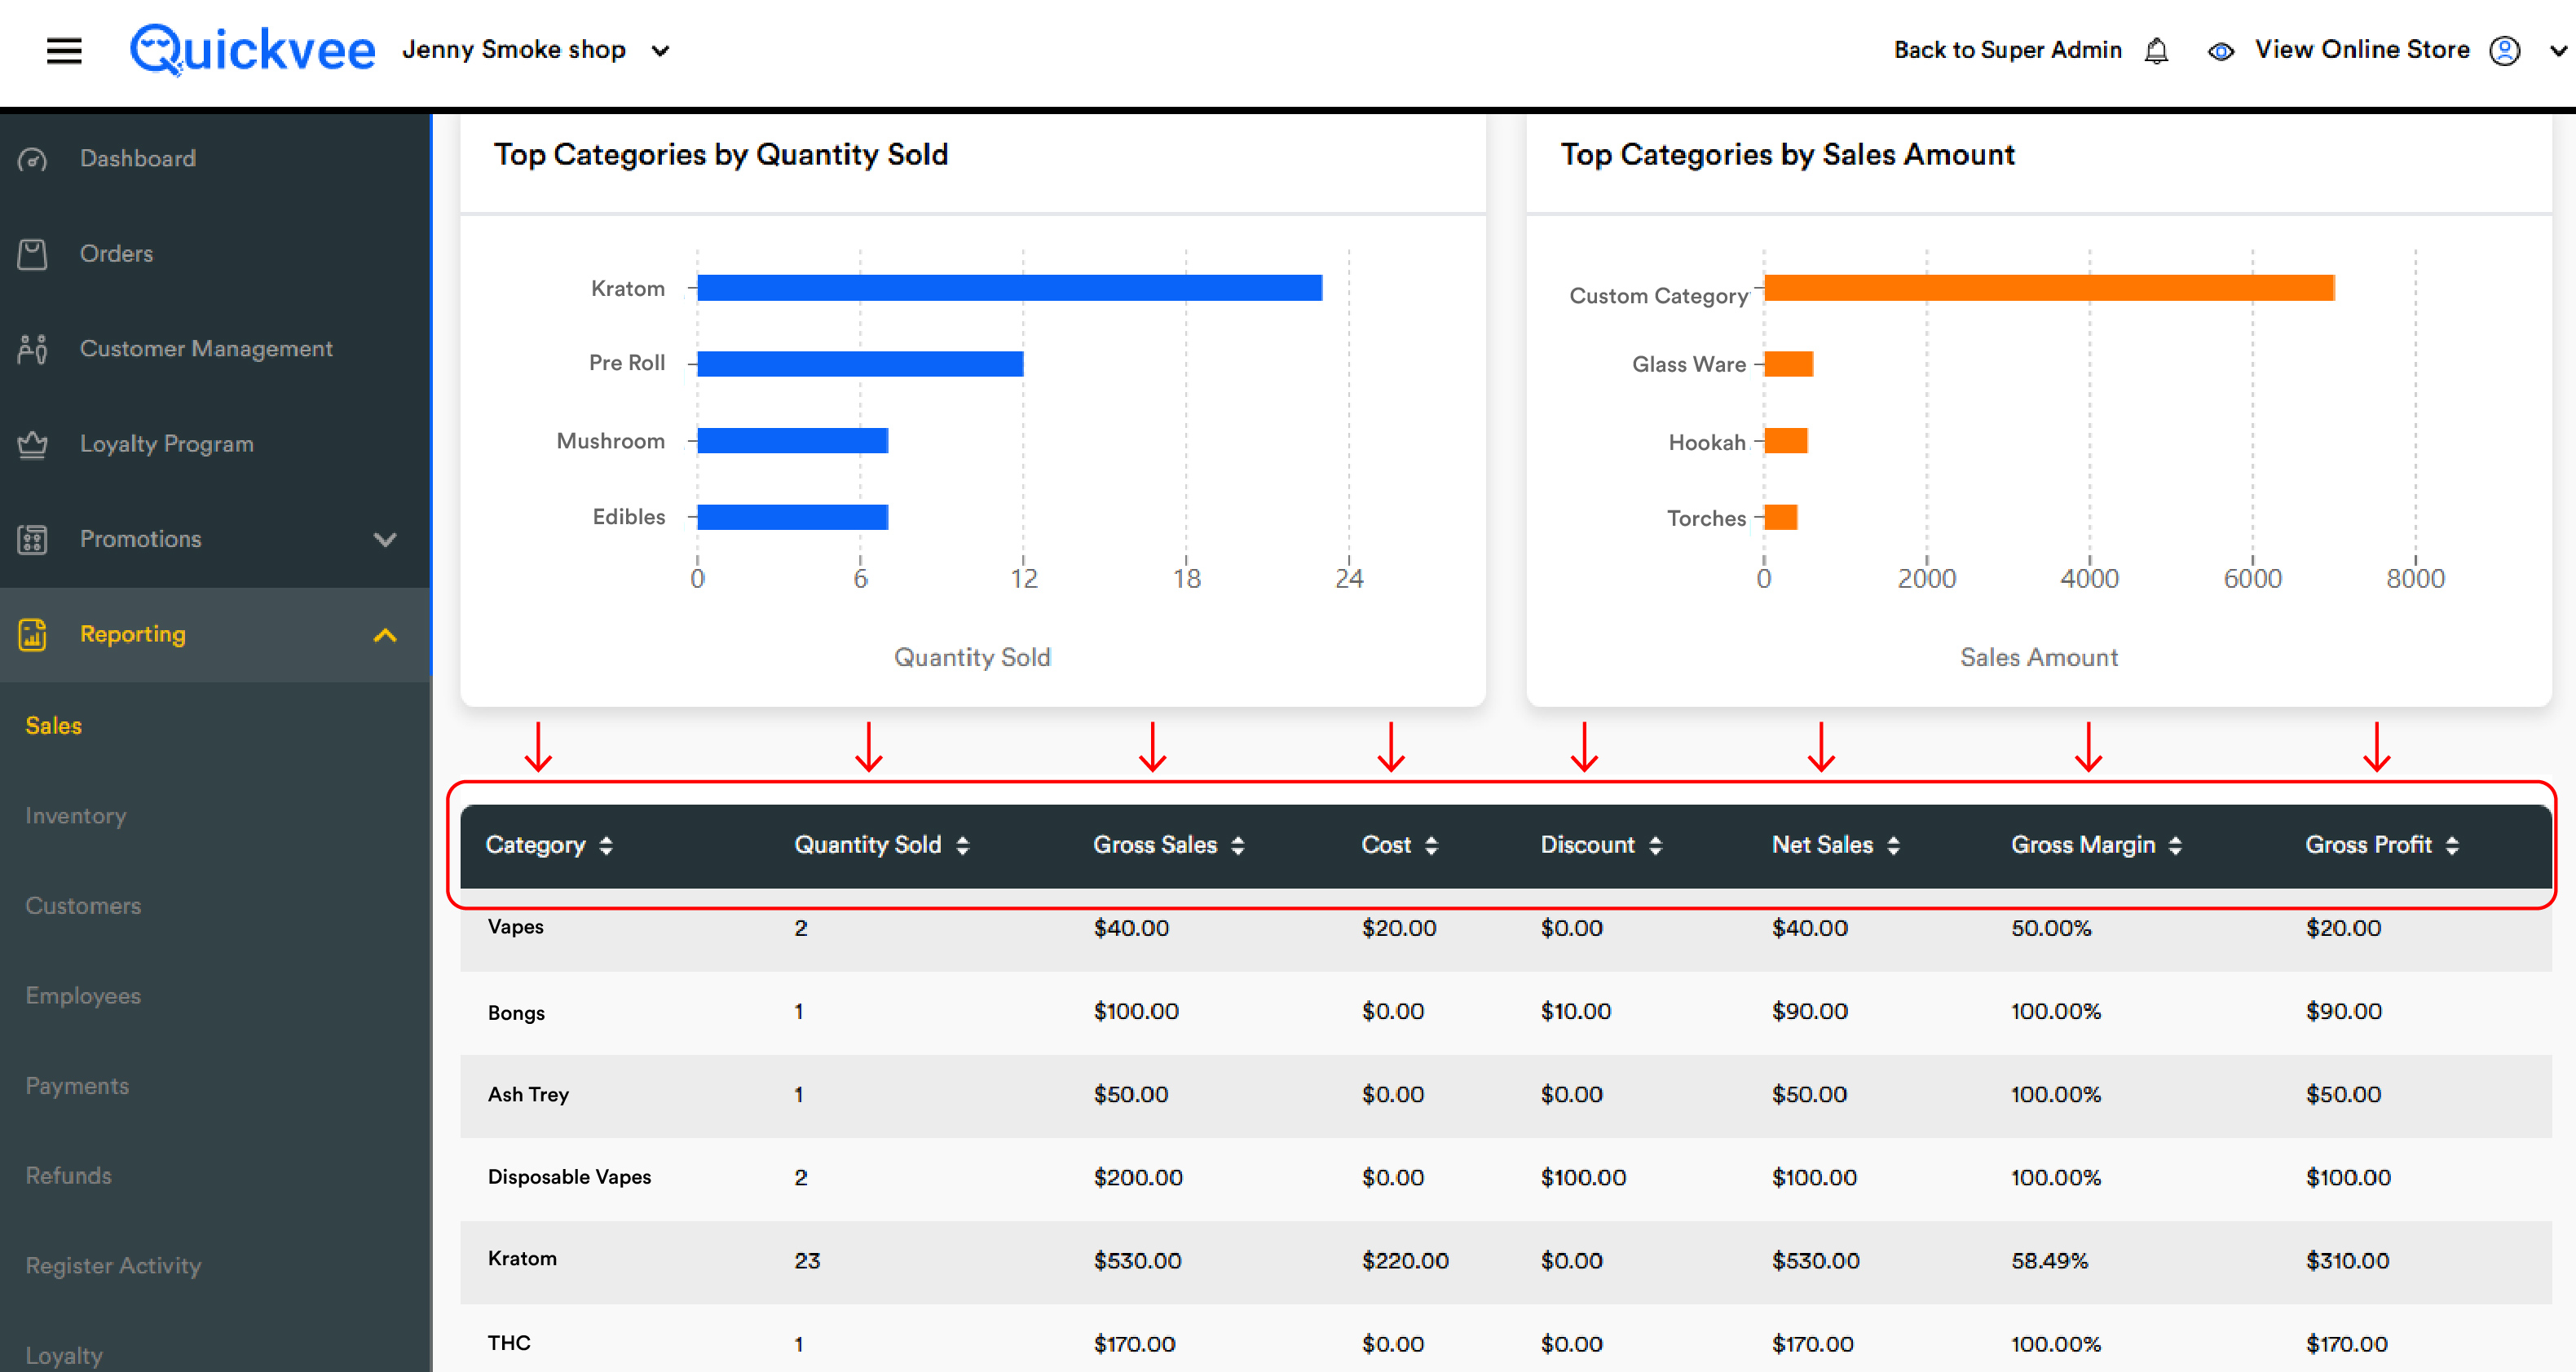
|
Column |
What it shows |
|---|---|
|
Category |
The product category name. Custom items keyed at the register appear under Custom Category |
|
Quantity Sold |
Total units sold across all paid orders, net of refunded units |
|
Gross Sales |
Total dollar value of items sold before discounts are subtracted |
|
Cost |
The merchant's cost basis, drawn from each product's configured cost price |
|
Discount |
Total discounts — coupons, custom discounts, loyalty redemptions, BOGO, Mix N' Match, OTD allocated to category items |
|
Net Sales |
Gross Sales − Discount. The actual revenue the merchant collected before subtracting cost |
|
Gross Margin |
Profit as a percentage of Net Sales — |
|
Gross Profit |
Net Sales − Cost. The dollar amount earned after paying for the goods |
The Total row
The Total row sums every column except Gross Margin. The Total Gross Margin is computed against the Total Net Sales and Total Cost — not the arithmetic mean of the per-category margins. This makes it the merchant's true blended margin for the period, weighted by each category's contribution to revenue.
How to use the margin and profit columns
The two profitability columns are the entire point of this report — they don't appear in any other Sales Report.
Sort by Gross Margin descending
Surfaces the highest-margin categories: where every dollar of sales returns the most profit. These are your quality categories. Custom Category often shows 100% margin (cost = $0 because custom items don't have configured cost basis).
Sort by Gross Margin ascending
Surfaces the lowest-margin categories: the commodity categories eating most of their revenue in cost. Cigarettes typically runs ~12% margin — a category that contributes revenue but very little profit.
Sort by Gross Profit descending
Surfaces the dollar contributors. A high-margin category doesn't matter if its sales are too small to move the needle. These are the categories worth defending against stockouts and worth promoting.
Compare Margin against Discount
Within a row, check whether Discount is eating margin. If Net Sales is much lower than Gross Sales, heavy discounting is shaving profit even on items with otherwise healthy margins. Sort by Discount descending to find your most-discounted categories.
Common workflows
"Which category made me the most money yesterday?"
Quick filter → Yesterday → Search. Sort by Gross Profit descending. The top row is your single most profitable category.
"Where is my margin pressure?"
Quick filter → Last 30 Days → Search. Sort by Gross Margin ascending. Check whether their volume justifies their slimness or renegotiate cost with suppliers.
"Is my discount strategy working in this category?"
Filter By → select the category. Compare Discount against Quantity Sold and Gross Margin. Heavy discount + high volume + acceptable margin = working. Heavy discount + low volume + low margin = not paying off.
"Find categories I should promote more"
Sort by Gross Margin descending to find high-margin candidates. Check the Quantity Sold column — if low, it's a missed opportunity. Driving more units in a high-margin category lifts gross profit faster than in a low-margin category.
"Total margin check"
Read the bottom row. Total Gross Margin is your blended profit rate for the entire range. Compare across periods to see if profitability is steady, improving, or eroding.
"What's my Custom Category telling me?"
The Custom Category row groups every item keyed in at the register as a custom (off-catalog) item. If this row is large, cashiers are entering a lot of off-menu items — either products that should be added to the catalog or one-off services. Cost is typically $0, which makes 100% margin artificial and inflates blended margin.
Important notes
Only paid orders are included. Refunds reduce Quantity Sold, Gross Sales, and Net Sales proportionally.
Cost is drawn from each product's configured cost price. Products without a configured cost contribute $0 to Cost — which inflates Gross Margin and Gross Profit artificially.
Discount column allocates discounts at item level. Coupons and order-level discounts are allocated to the categories of the items they affected. BOGO and Mix N' Match are allocated to qualifying and rewarded items.
Tax is not included in any column. All figures are pre-tax. For tax-inclusive totals, use Daily Sales Totals or Overall Sales Summary.
Categories with zero activity are omitted from the table. Only categories with at least one sale in the range appear.
Gross Margin is computed against Net Sales, not Gross Sales. This is after discounts. A heavily-discounted category will show lower Gross Margin even if underlying product margin is good. Check the Discount column to see where the pressure is coming from.
Filters do not auto-apply. Changing the date range, category filter, or outlet requires tapping Search.
A 100% Gross Margin row usually means missing cost data, not a true 100% profit. Check the product catalog and ensure cost prices are set, then re-run.
Calculation reference
|
Field |
Formula |
|---|---|
|
Quantity Sold |
|
|
Gross Sales |
|
|
Cost |
|
|
Discount (all types) |
|
|
Net Sales |
|
|
Gross Profit |
|
|
Gross Margin % |
|
Mix Match discount is stored negative, so ABS() is used. Gift card items are excluded. Top charts return the top 4 categories sorted by highest value.