
The Overall Sales Summary is the merchant's "everything on one page" view of business performance for a given period. Where other reports specialize in one dimension (per-day, per-hour, per-item, per-category), Overall Sales Summary consolidates all of them: KPIs, sales flow from gross to net, tax collected and broken out by rate, fees, payment-method breakdown, register payouts, and end-of-day cash reconciliation.
Access path: Quickvee Web (merchant backend) → Reporting → Sales Reports → select Overall Sales Summary from the report dropdown
%20%E2%86%92%20Reporting%20%E2%86%92%20Sales%20Reports%20(1)-20260602-084822.jpg?cb=0f6e4bf2277b47c3a23fd94510d4666c)
It's the report to use for end-of-shift closeout, bookkeeping handoff, multi-store roll-ups, and any time you need one document that captures the full financial picture of a period.
The filter bar
The filter bar at the top controls every section of the report. Filters apply only after Search is tapped.
-20260602-084846.jpg?cb=814997b29f3b51f22973384721ee7464)
Quick date filters
|
Quick Filter |
Range Applied |
|---|---|
|
Today |
Today only |
|
Yesterday |
Yesterday only |
|
Last 7 Days |
Rolling 7-day window ending today |
|
Last 14 Days |
Rolling 14-day window ending today |
|
Month to Date |
First of current month through today |
|
Year to Date |
January 1 of current year through today |
Manual date range
Pick Start Date and End Date with the calendar pickers for any custom range — a promo week, a holiday period, a specific shift.
Stores
For multi-store accounts, the Stores dropdown selects one outlet, several, or All Stores. All Stores is unique to Overall Sales Summary — most other reports run one outlet at a time, but this one consolidates across selected stores into a single rolled-up view.
Search, Print & Export
-
Search — applies the current filters and reloads every section
-
Print — generates a print-friendly version of the report for receipt printer or office printer output
-
Export Report — downloads the report for sharing or use in Excel
Key performance indicators
Four headline cards — the four numbers a merchant wants at a glance before drilling into detail.
|
KPI |
What it shows |
|---|---|
|
Avg Transaction Value |
Average dollar value per transaction in the range. Below the number: total transaction count |
|
Refund Rate |
Refunds as a percentage of gross sales. Below the number: total dollars refunded |
|
Est. Profit Margin |
Estimated margin based on a flat 30% COGS assumption. For true margin per category, use Sales by Category which uses each product's configured cost |
|
Top Payment Method |
The payment tender that brought in the most dollars in the range, with the amount collected via that tender |
Est. Profit Margin is an estimate. It uses a flat 30% COGS assumption. For accurate per-category margin grounded in actual product costs, use the Sales by Category report.
Sales Summary
The Sales Summary section shows the full gross-to-net flow — Gross Sales on the left in blue, Net Sales on the right in green, deductions and intermediate values stacked in the middle:
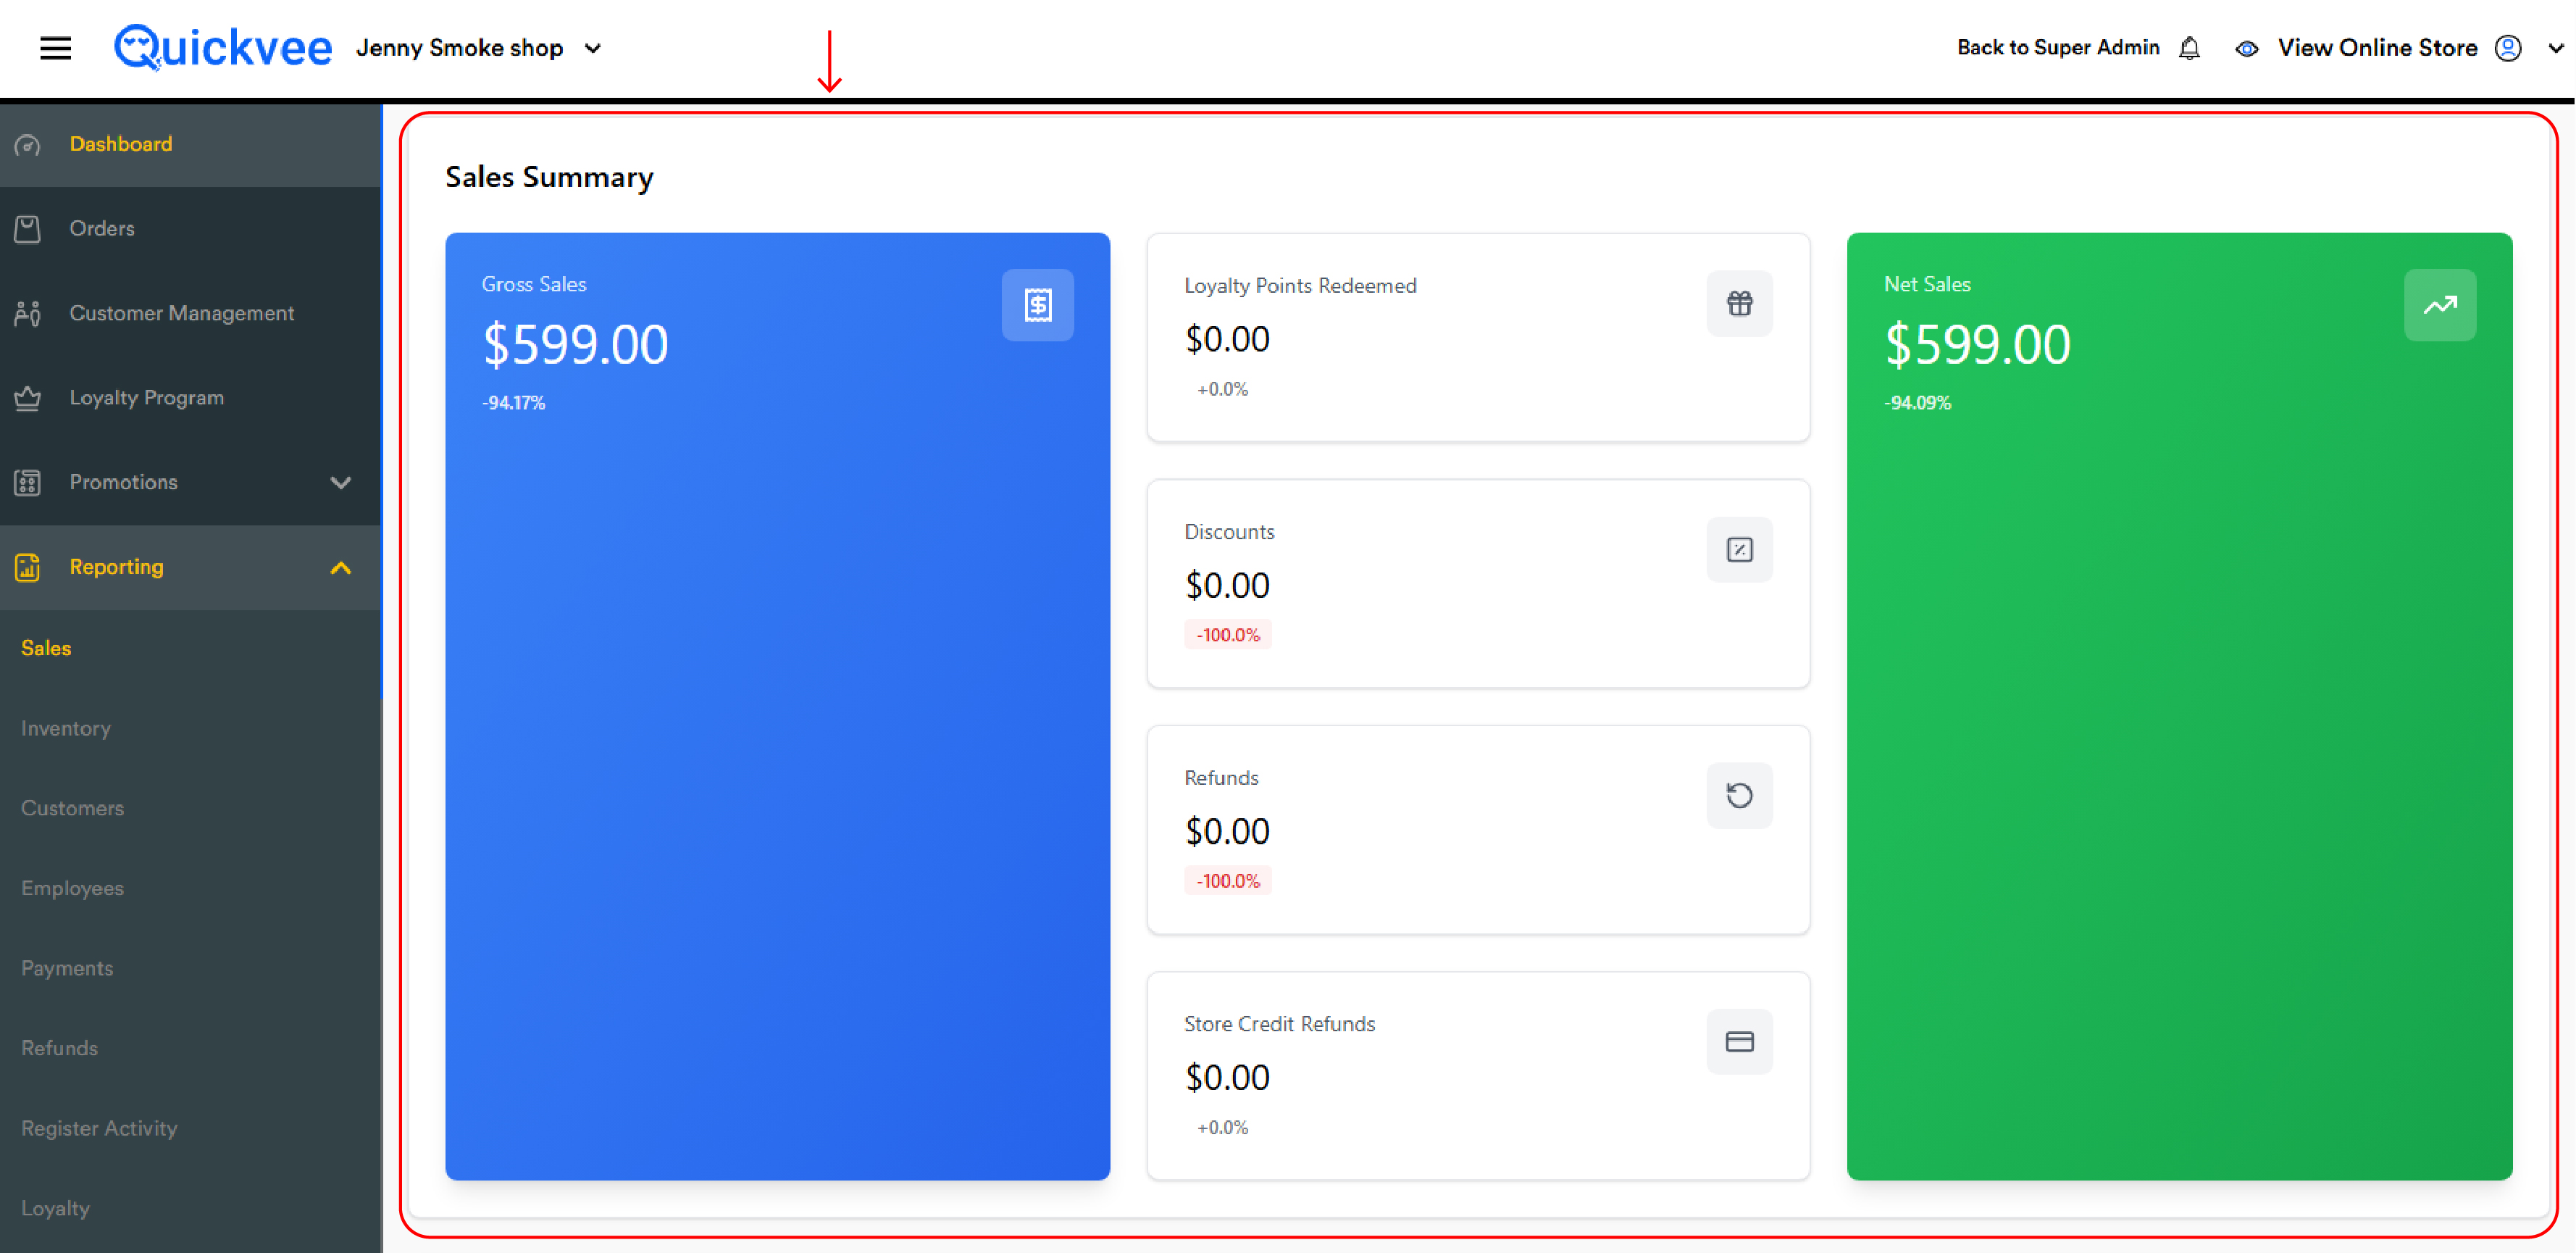
|
Card |
What it shows |
|---|---|
|
Gross Sales (left, blue) |
Total dollar value of items sold before any reductions |
|
Loyalty Points Redeemed |
Dollar value of loyalty point redemptions applied as discounts in the range |
|
Discounts |
Total dollar value of all other discounts (custom, coupon, BOGO, Mix N' Match, OTD) excluding LP |
|
Refunds |
Dollar value of refunds processed in the range |
|
Store Credit Refunds |
Dollar value of refunds returned as store credit rather than to the original tender |
|
Net Sales (right, green) |
Final revenue after subtracting all of the above. Pre-tax |
Each middle card shows a period-over-period change indicator versus the previous comparable period.
The arithmetic relationship:
Net Sales = Gross Sales − Loyalty Points Redeemed − Discounts − Refunds − Store Credit Refunds
Tax Collection Summary
Every tax rate configured for the merchant, broken out individually, plus a roll-up.
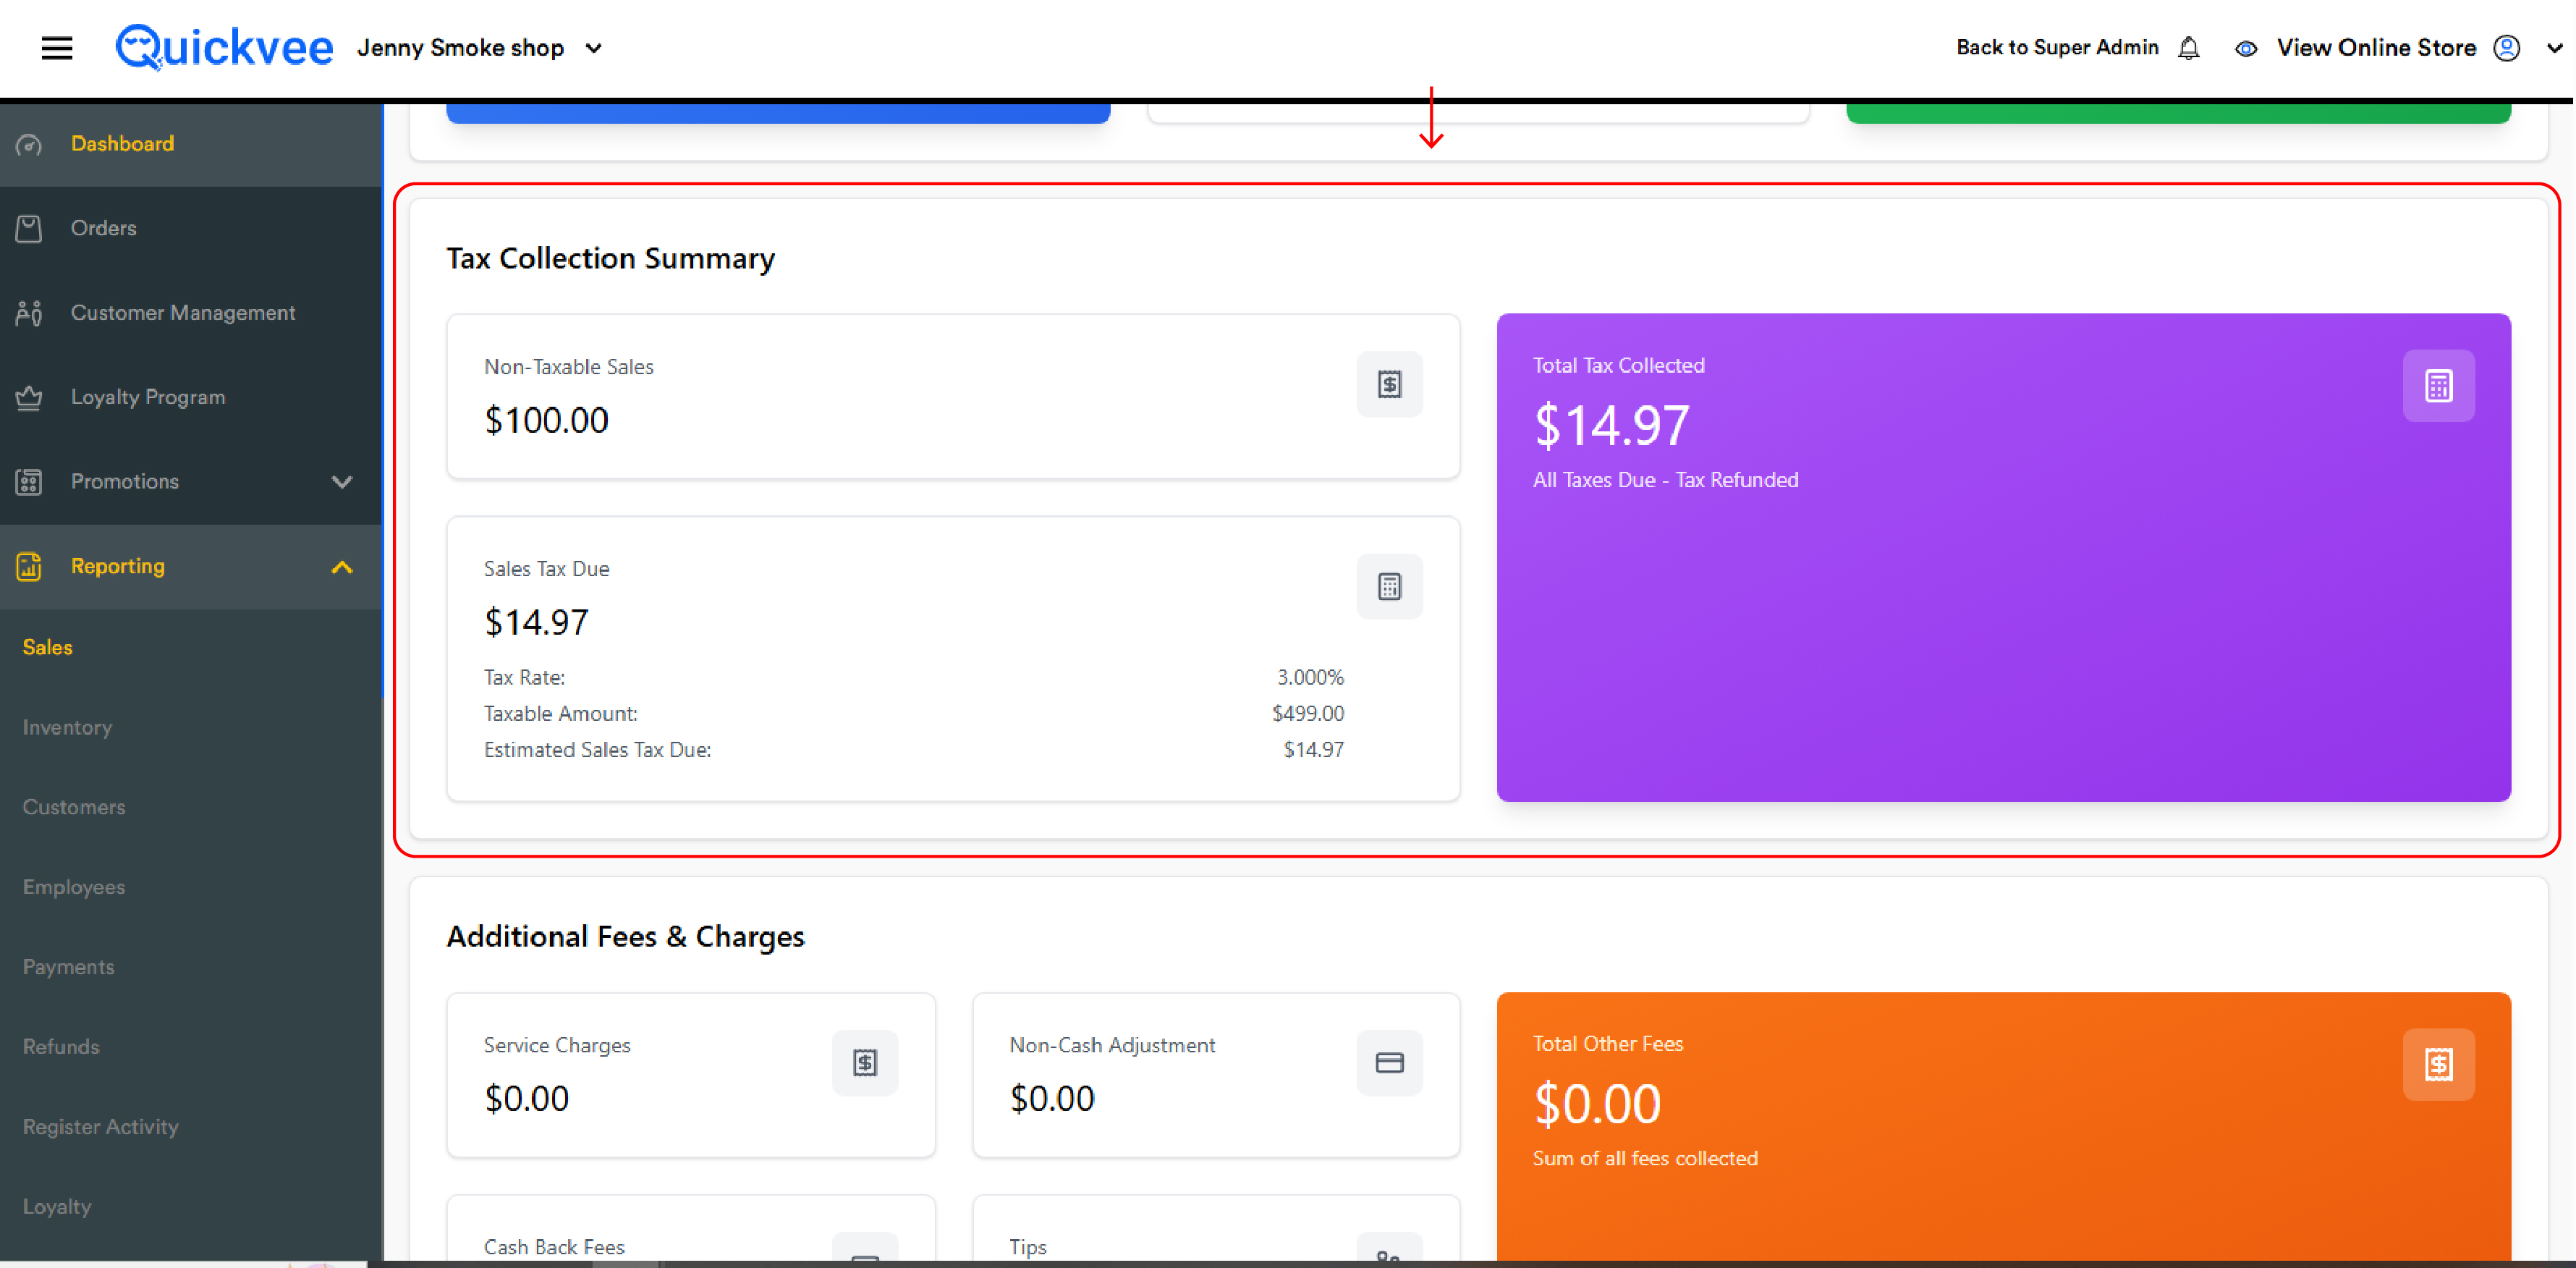
|
Card |
What it shows |
|---|---|
|
Non-Taxable Sales |
Total dollar value of sales that did not have tax applied (tax-exempt items or exempt customers) |
|
Individual Tax Rate Cards |
One card per tax rate configured (e.g. CC Due at 3.750%, Sales Tax Due at 4.750%). Each card shows the rate, the taxable amount it applied to, and the dollars due |
|
Total Tax Collected (purple) |
The sum of every individual tax rate, minus any tax refunded in the range. The merchant's total tax liability for the period |
One card per configured rate. Stores with both a state sales tax and a local excise tax see both as separate cards.
Additional Fees & Charges
Everything collected on top of sales — fees that are not tax and not the merchandise sale itself.
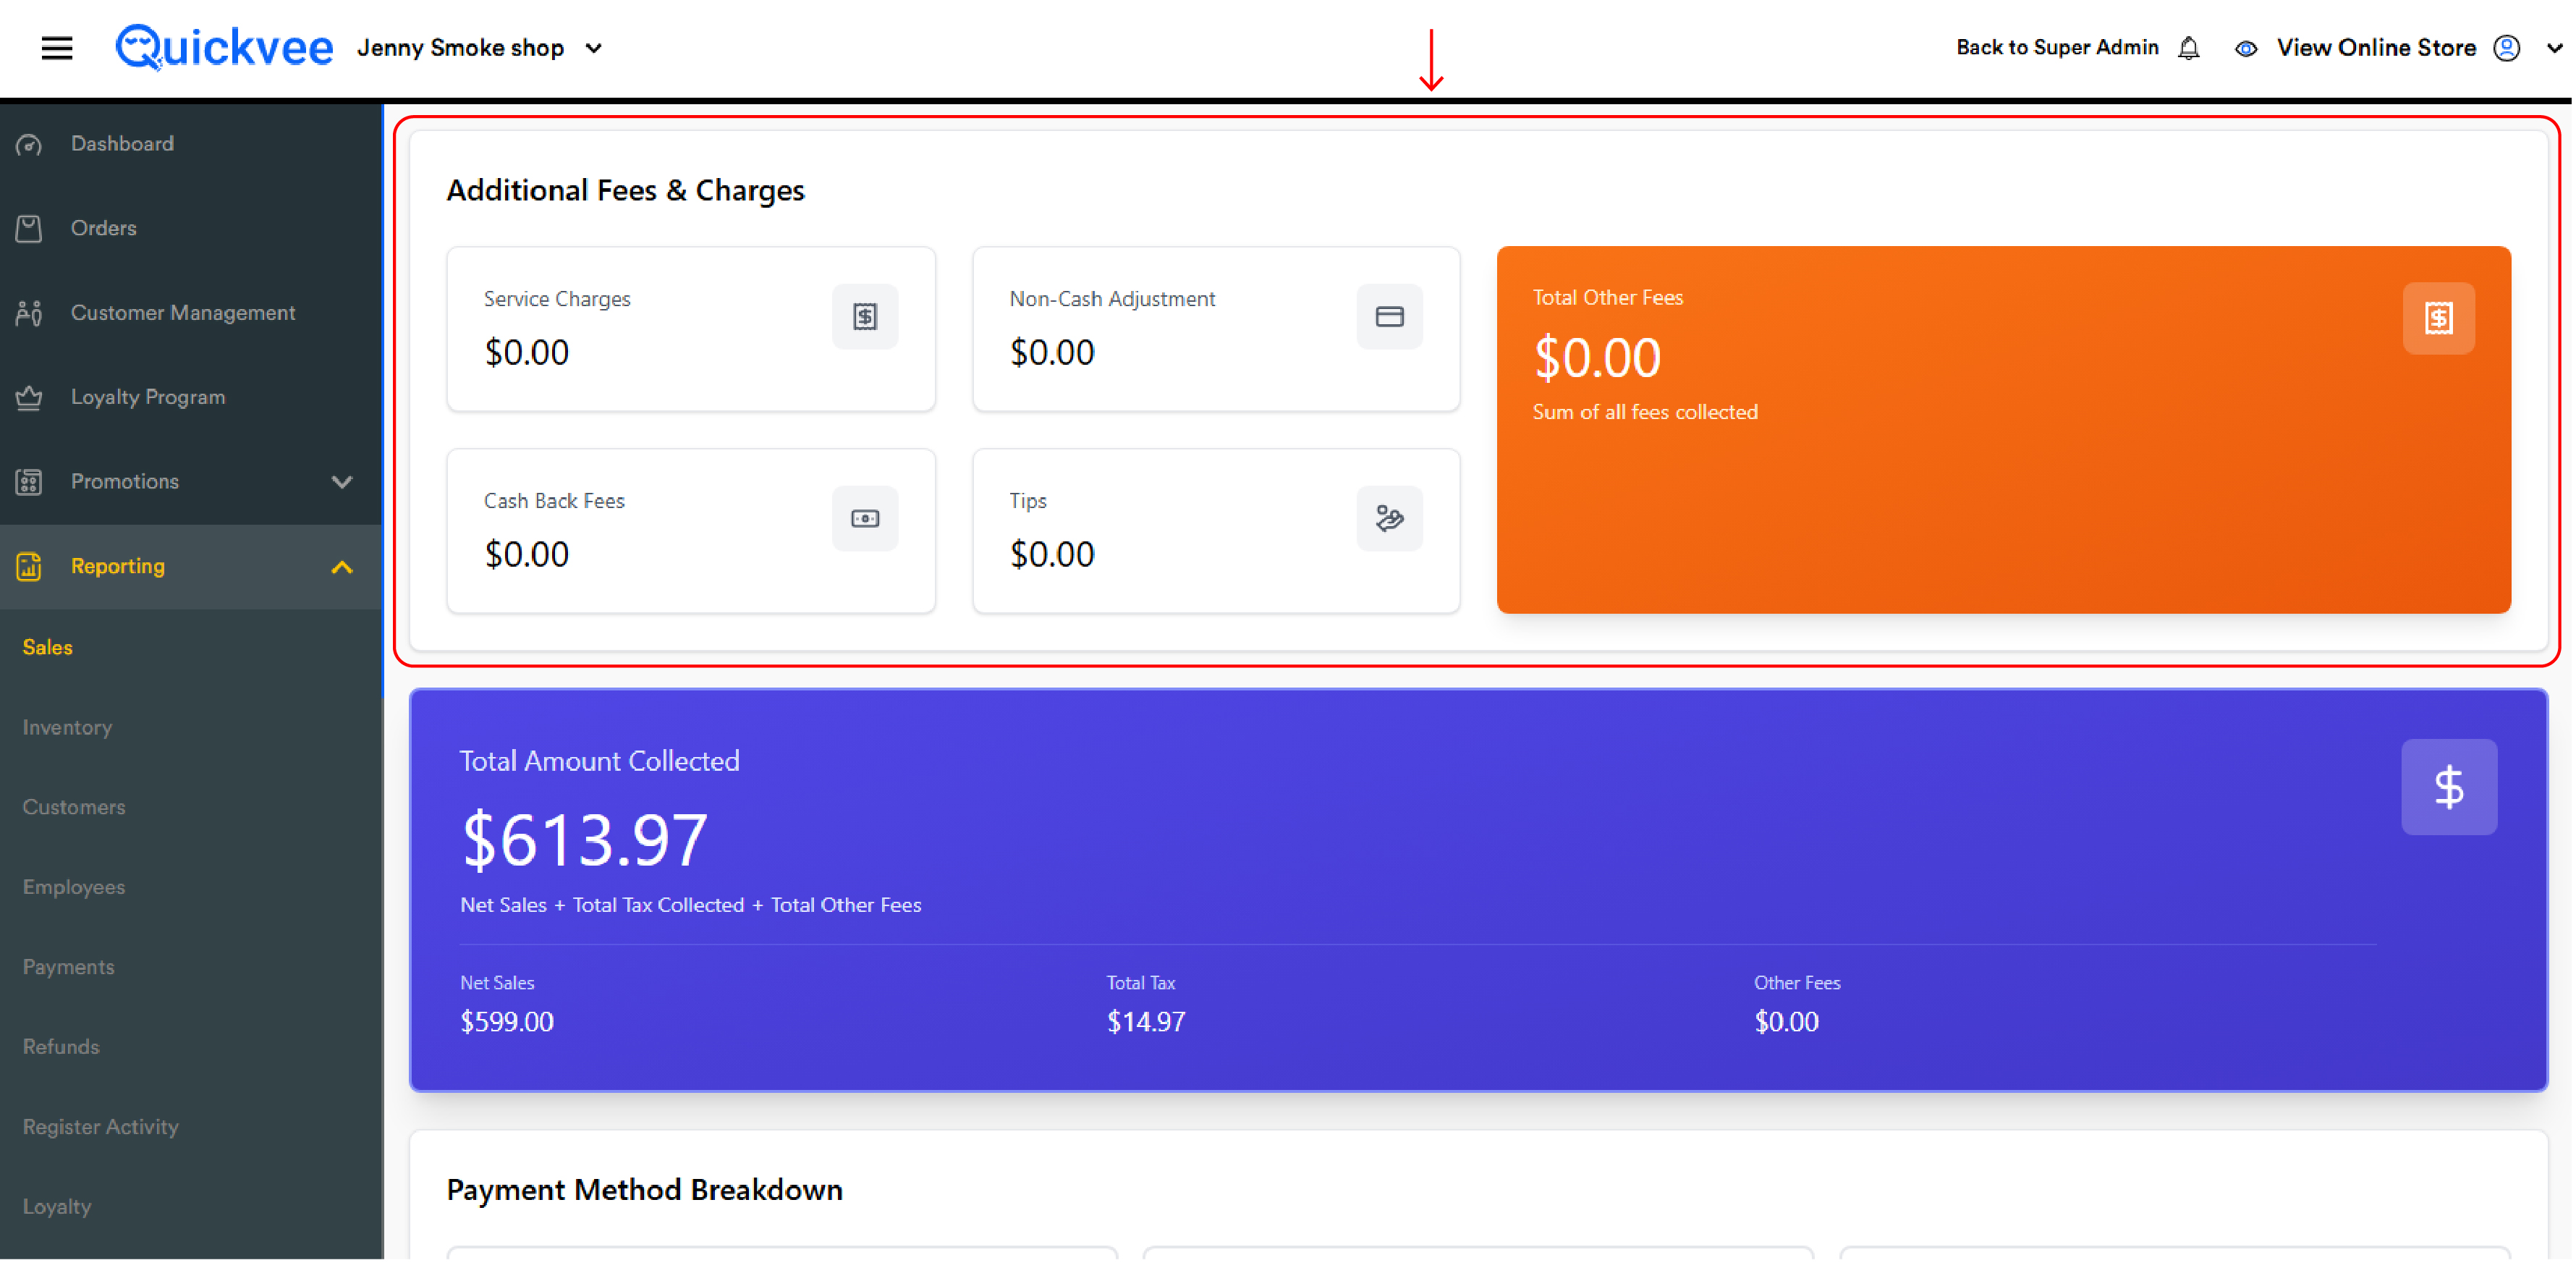
|
Card |
What it shows |
|---|---|
|
Service Charges |
Service fees applied to orders (e.g. delivery fees, surcharges) |
|
Non-Cash Adjustment |
The surcharge applied to credit/debit transactions when Non-Cash Adjustment is enabled |
|
Cash Back Fees |
Fees collected for cash back at register |
|
Tips |
Total tips collected in the range |
|
Total Other Fees (orange) |
Sum of all four — the bottom-line "fees" figure for the period |
Total Amount Collected
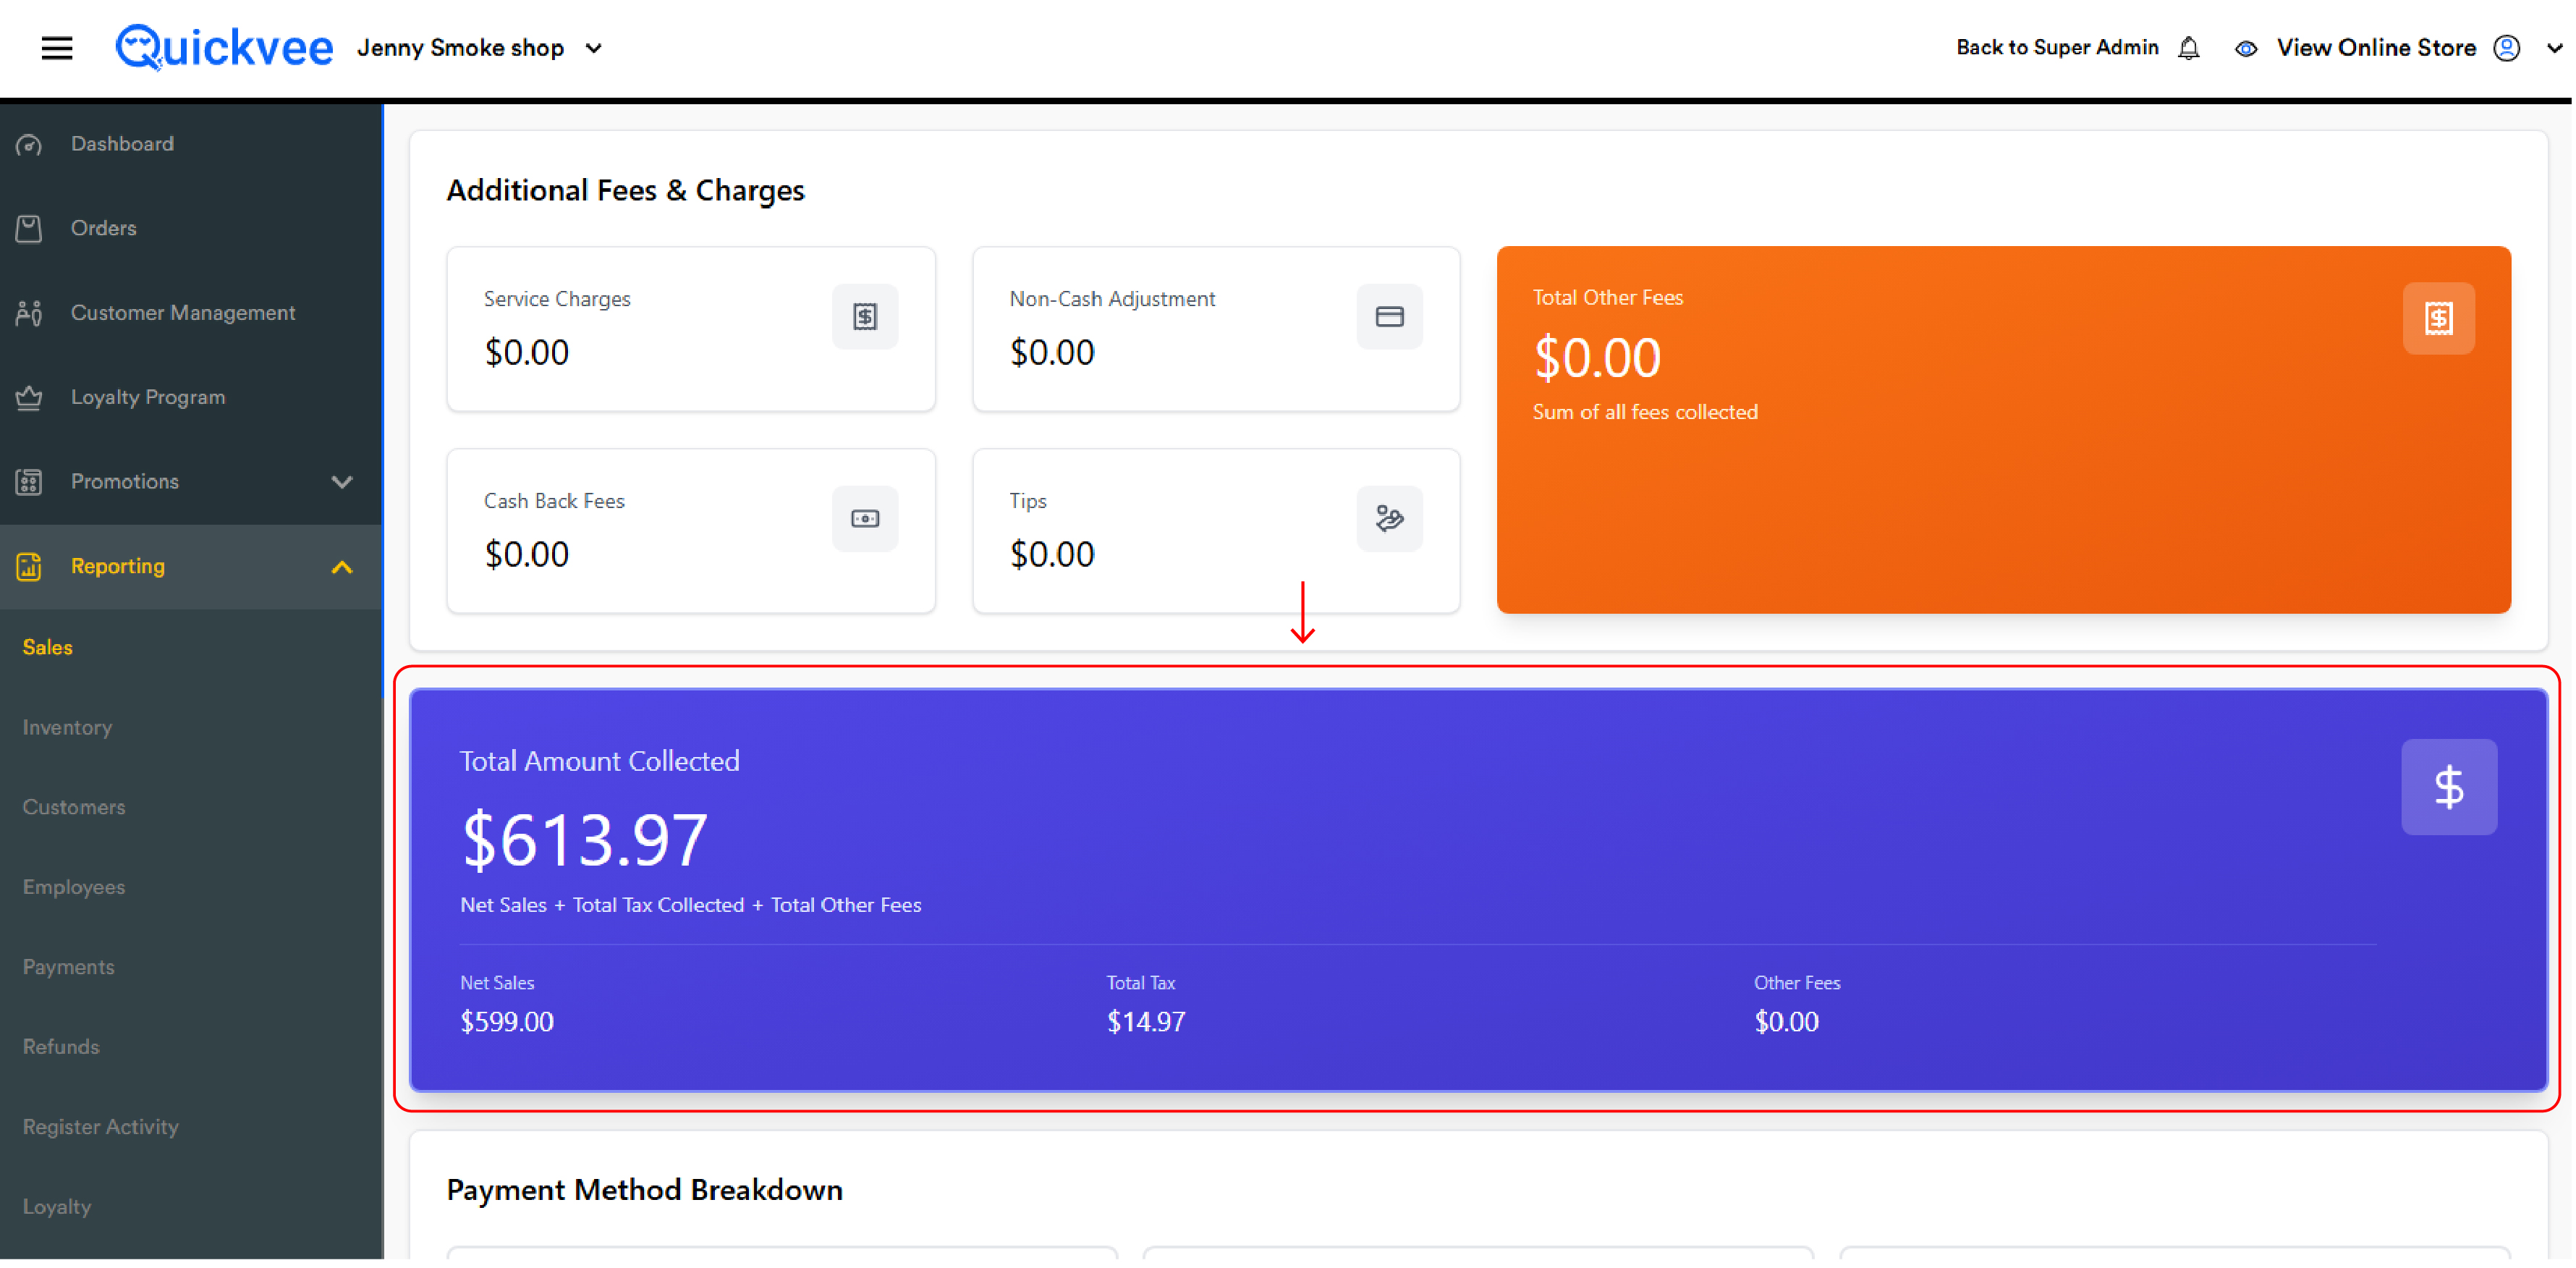
A single large band shows the total money taken in for the period:
Total Amount Collected = Net Sales + Total Tax Collected + Total Other Fees
This is the dollar figure that should have actually moved through the register and payment processor for the period. Below it, the breakdown into its three components is displayed for verification.
This figure should reconcile directly against the Total Collected card in the Payment Method Breakdown section — the two should always be within a cent of each other. Any difference points to a reconciliation issue worth investigating.
Payment Method Breakdown
A grid of payment-tender cards — one per tender type the merchant supports. Each card shows:
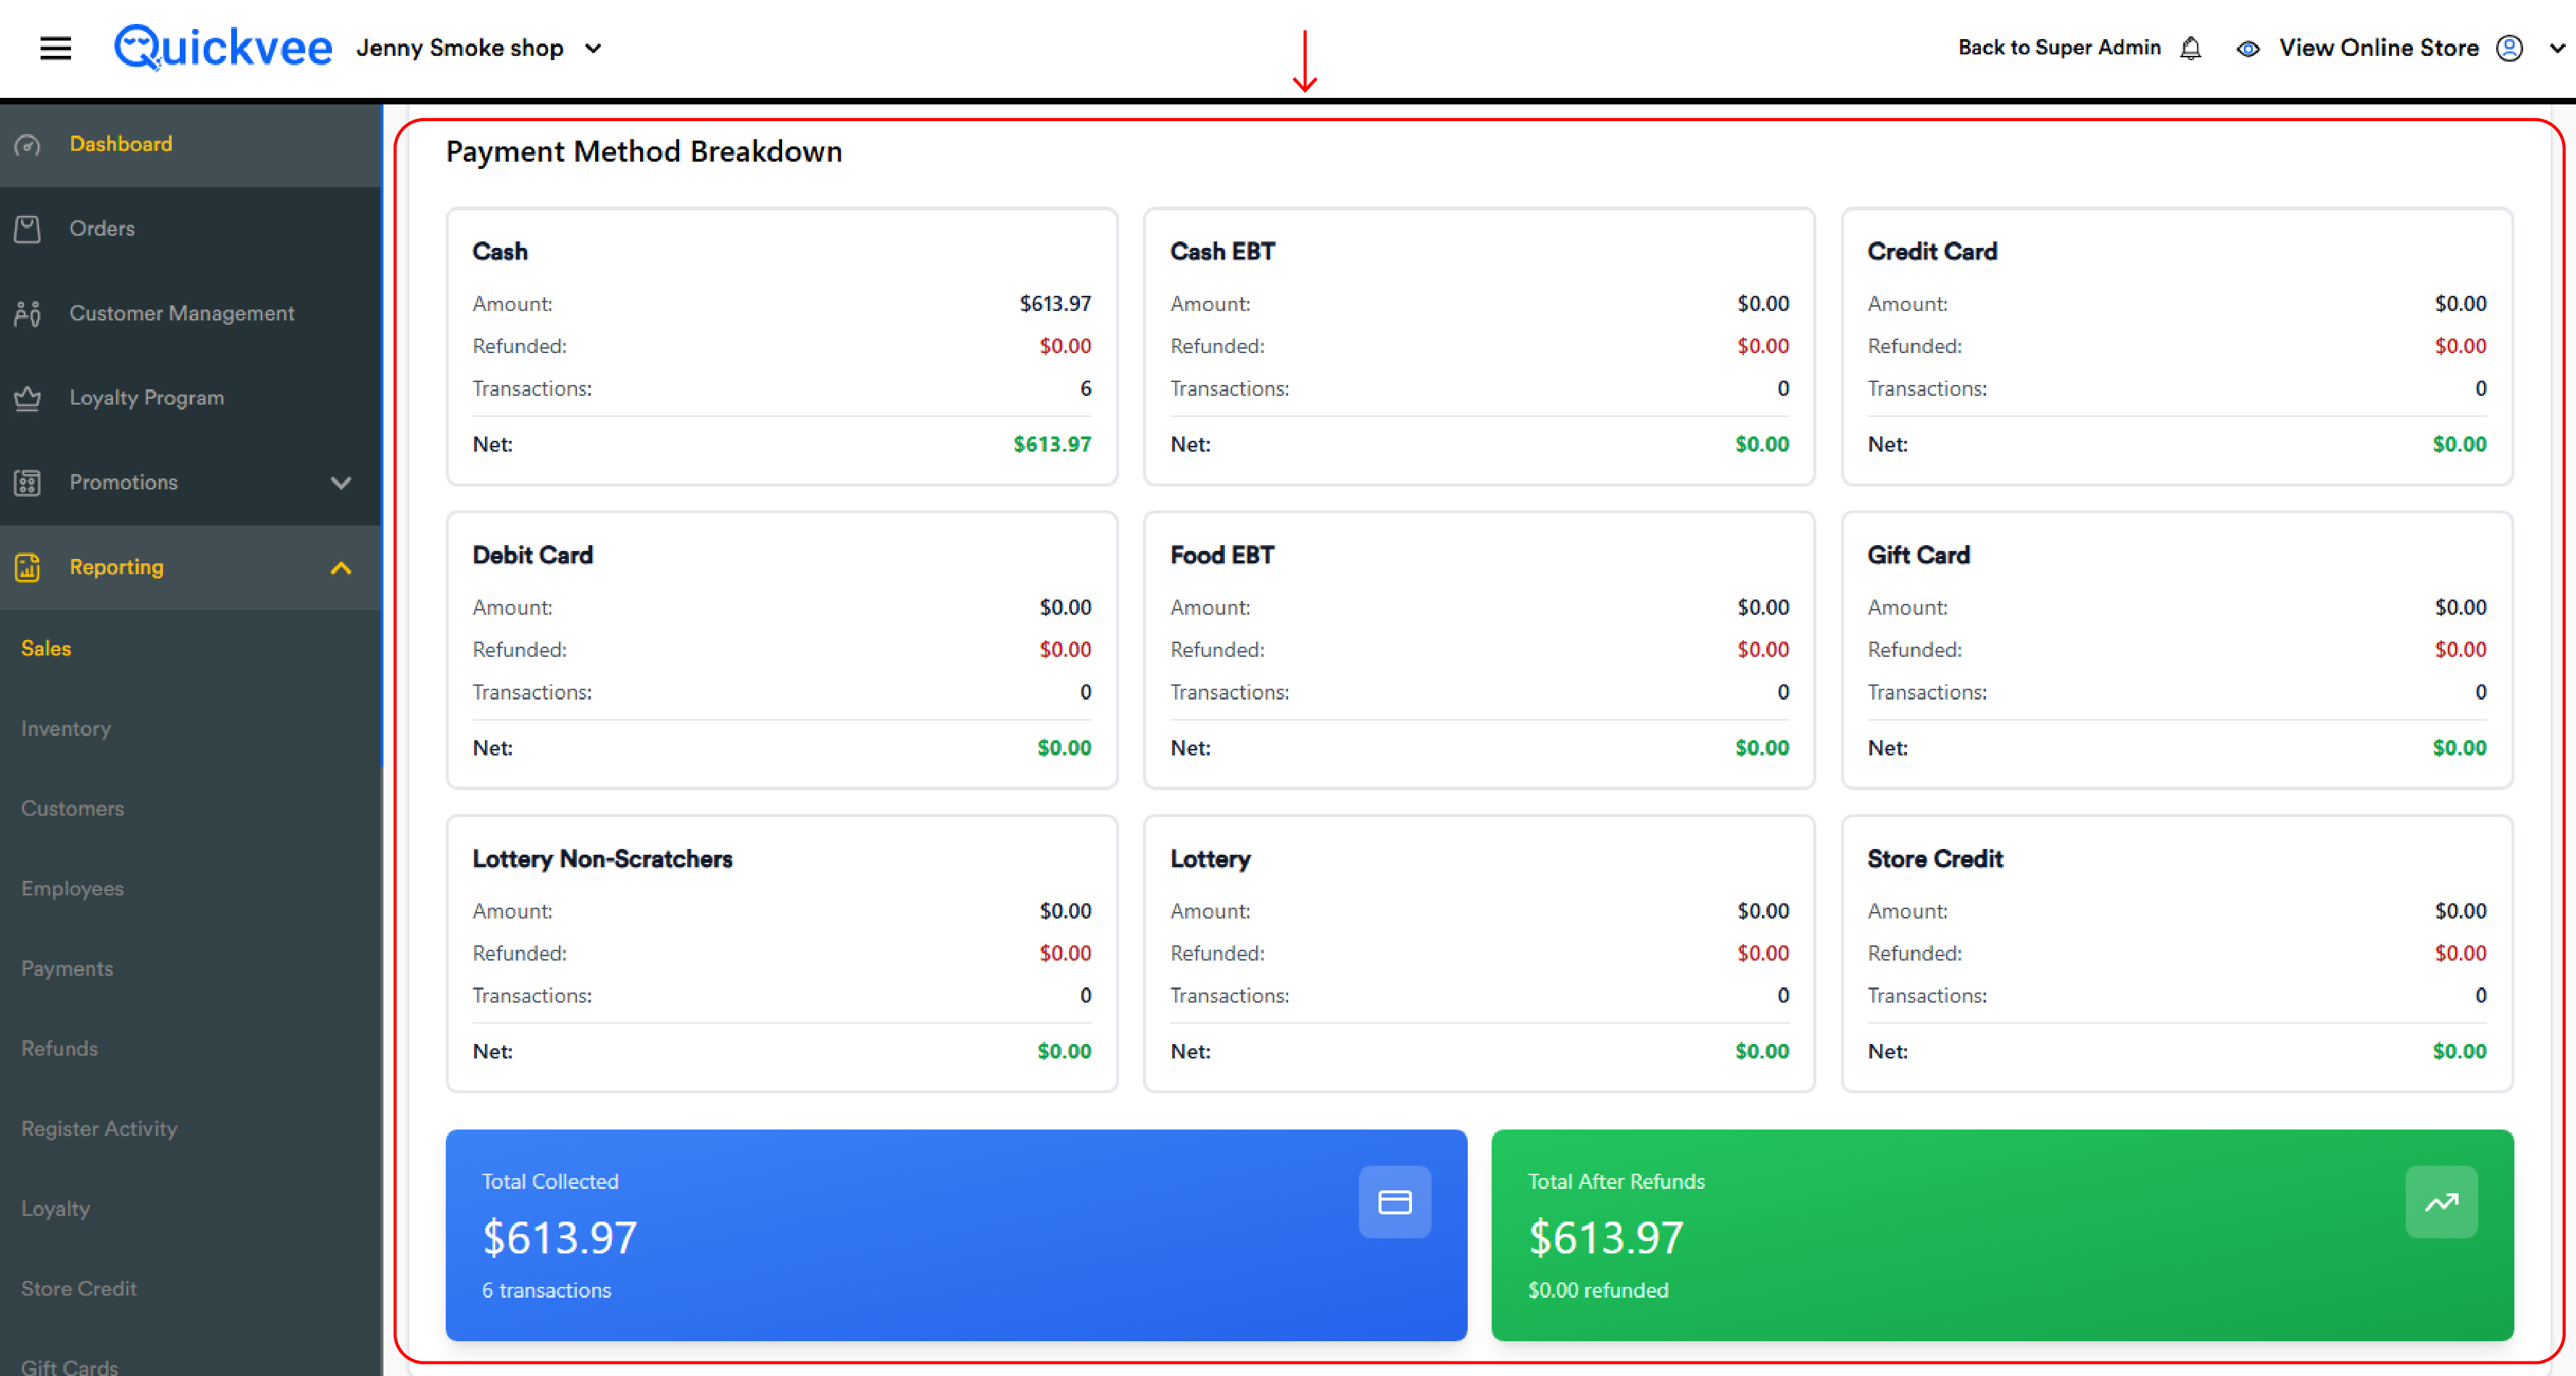
|
Field |
What it shows |
|---|---|
|
Amount |
Total collected through this tender in the range |
|
Refunded |
Total returned through this tender |
|
Transactions |
Count of transactions paid by this tender |
|
Net |
Amount − Refunded, the net intake for this tender |
Tenders covered: Cash, Cash EBT, Credit Card, Debit Card, Food EBT, Gift Card, Lottery Non-Scratchers, Lottery, Store Credit. Tenders with zero activity still appear in the grid showing $0.00.
Total Collected & Total After Refunds
-
Total Collected — the sum of every tender's Amount, with the transaction count
-
Total After Refunds — the sum of every tender's Net (Amount − Refunded)
Total After Refunds should match Total Amount Collected from the previous section. A discrepancy points to a reconciliation issue.
Register Payouts
Accounts for money that left the register without being a refund — typical end-of-day movements like cash drawer payouts to vendors or lottery prize payouts.
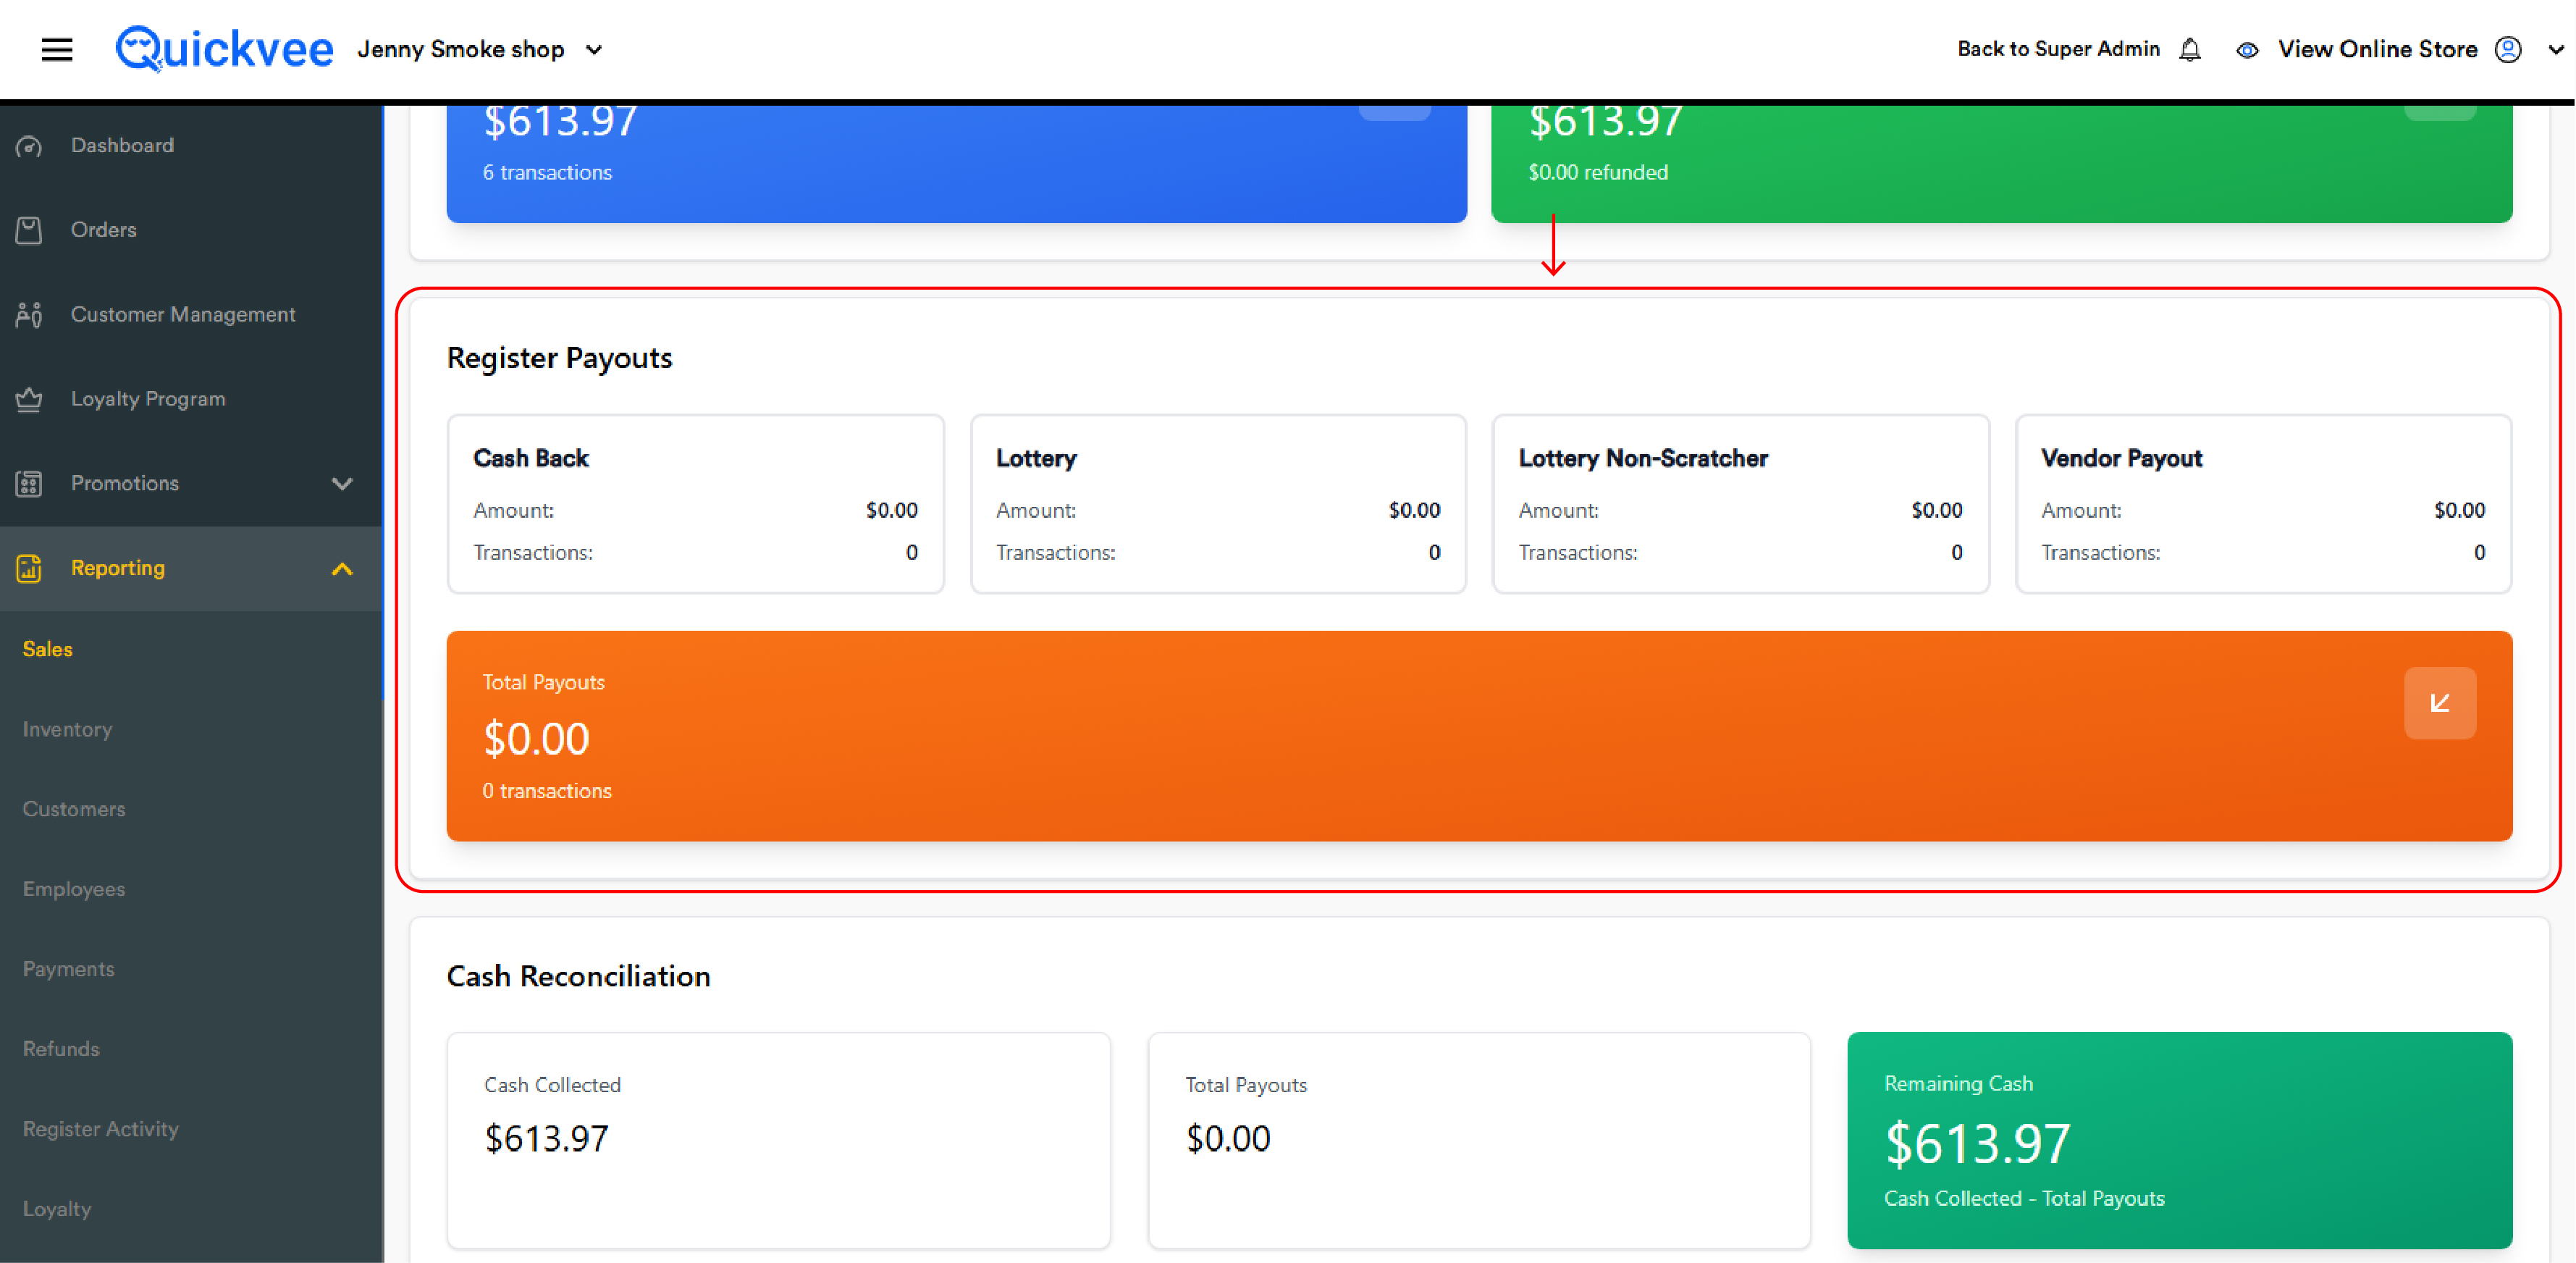
|
Card |
What it shows |
|---|---|
|
Cash Back |
Cash given to customers as cash back through the register |
|
Lottery |
Lottery scratcher prize payouts |
|
Lottery Non-Scratcher |
Powerball, Mega Millions, etc. prize payouts |
|
Vendor Payout |
Cash drawer disbursements made directly to vendors |
|
Total Payouts (orange) |
Sum of all four, with the total payout transaction count |
Cash Reconciliation
The final section closes the loop on the cash drawer:
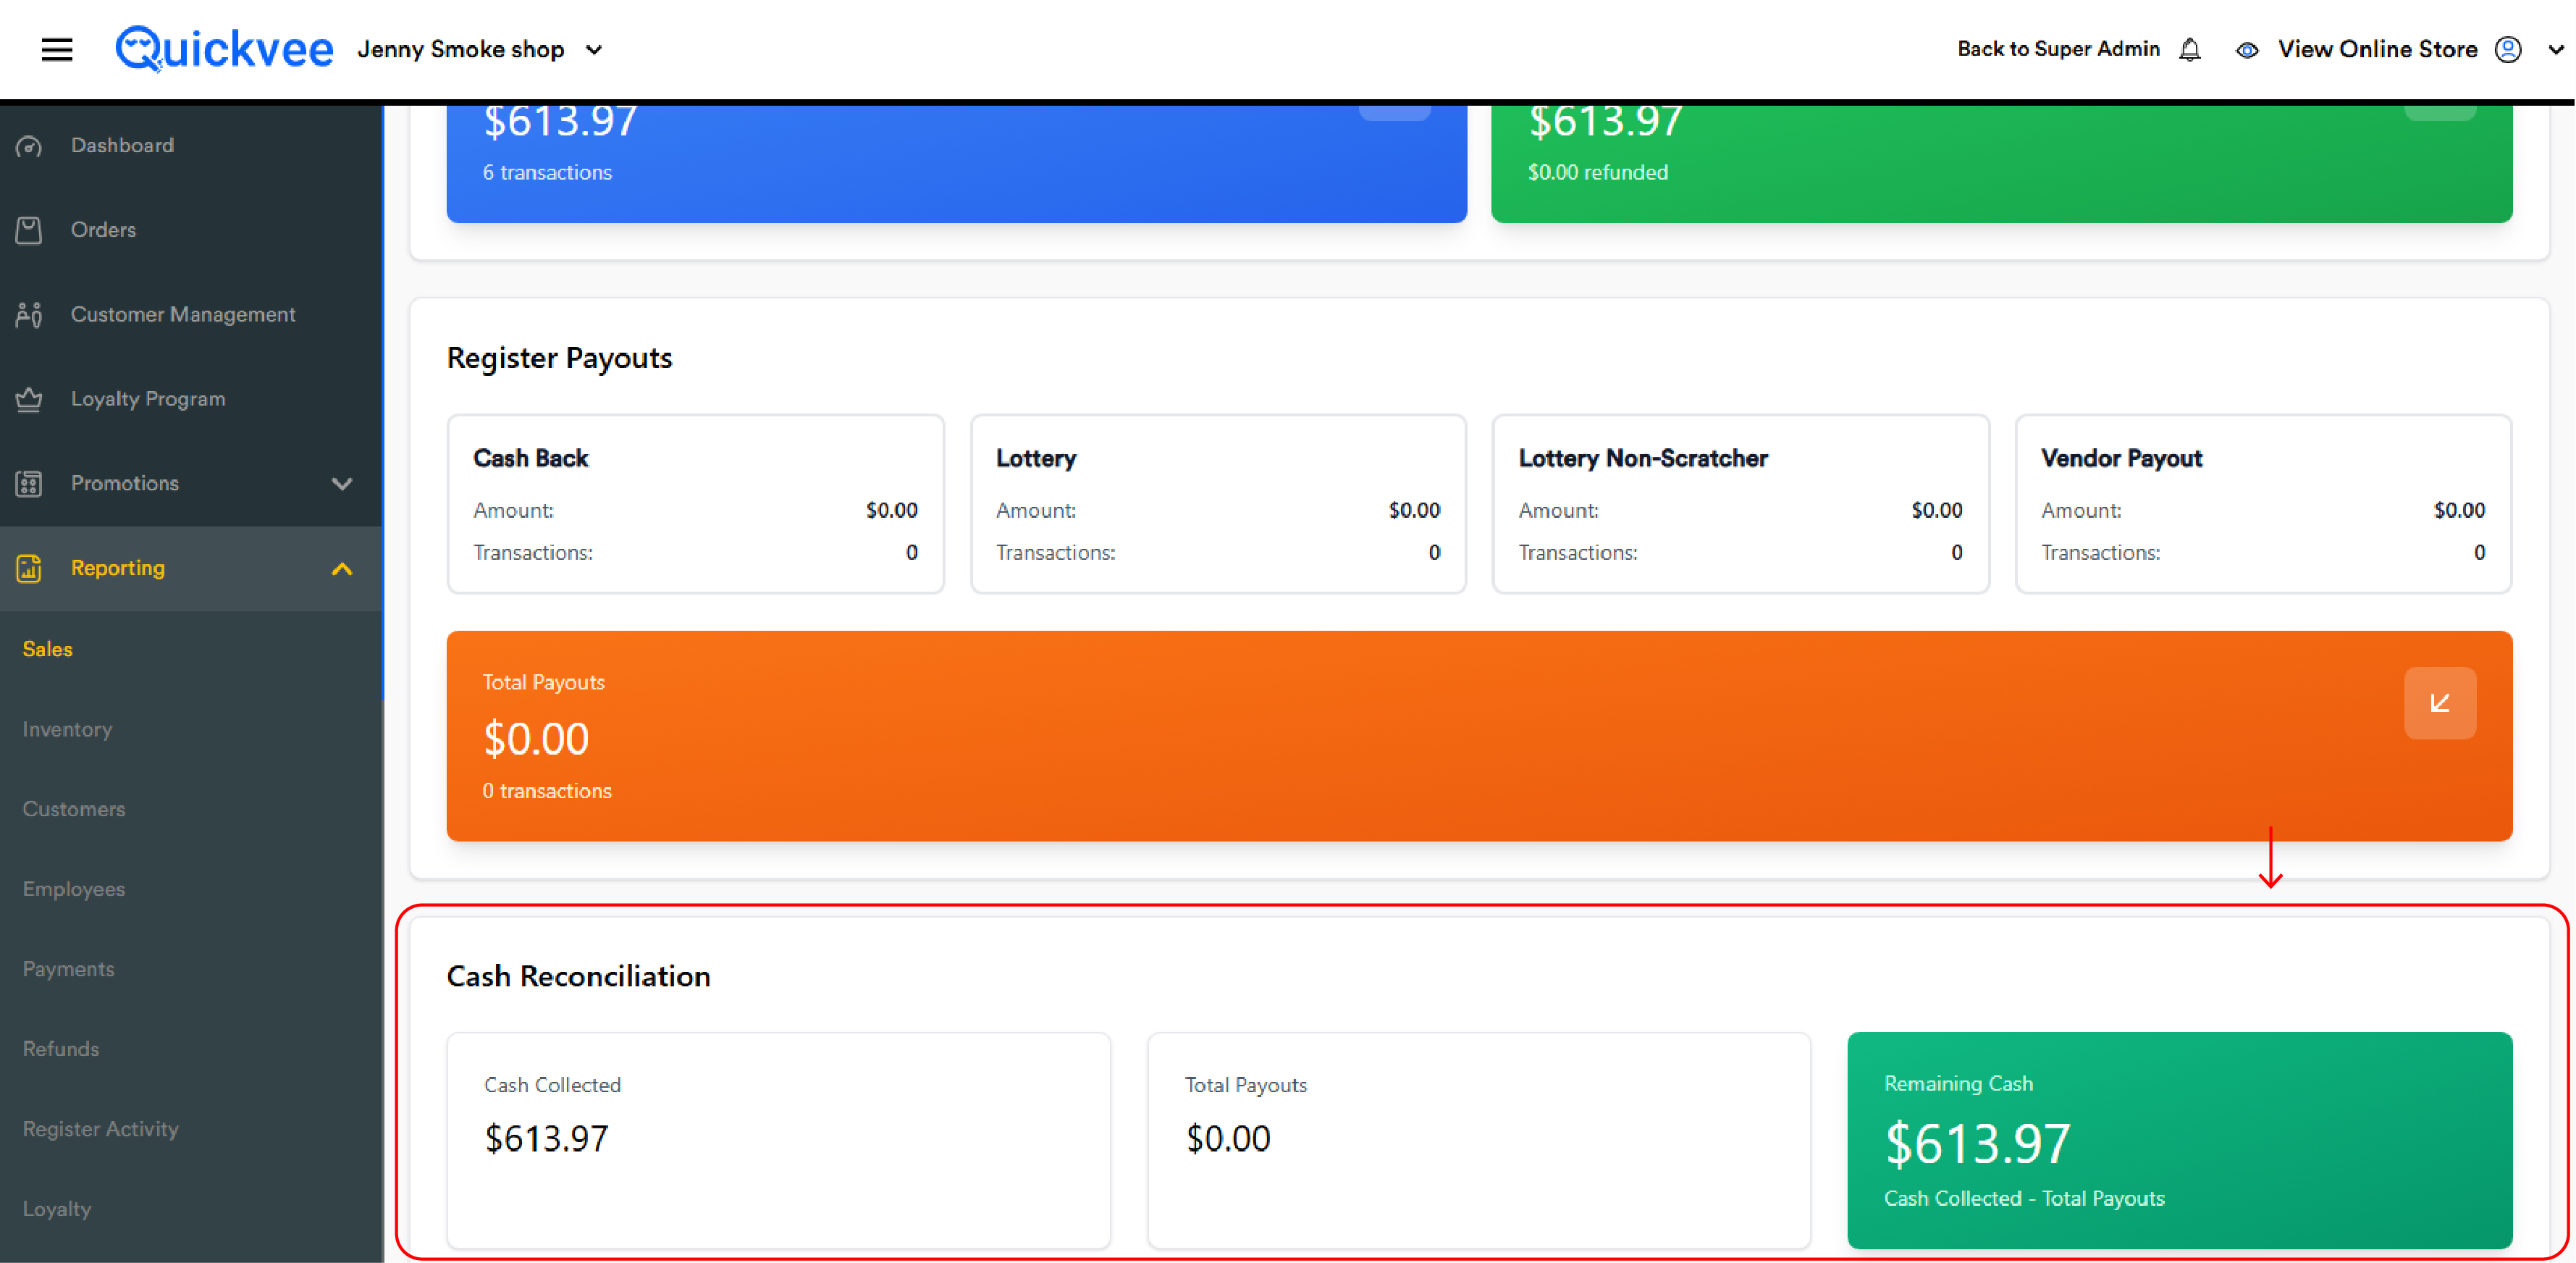
|
Card |
What it shows |
|---|---|
|
Cash Collected |
Total cash taken in (from the Cash card in Payment Method Breakdown) |
|
Total Payouts |
Total cash paid out (from Register Payouts section) |
|
Remaining Cash (green) |
Cash Collected − Total Payouts. The expected cash remaining in the drawer after the period |
This is the figure to match against the physical drawer count at end of day. Discrepancies indicate till errors, miscounts, or unrecorded payouts.
Common workflows
"Close out yesterday — give me everything"
Quick filter → Yesterday → Search. Read top to bottom:
-
KPIs for the at-a-glance health check
-
Sales Summary for the gross-to-net flow
-
Tax Collection Summary for tax to remit
-
Total Amount Collected as the period's total intake
-
Payment Method Breakdown for tender-by-tender split
-
Register Payouts for cash that left the drawer
-
Remaining Cash for the drawer count match
Tap Print at the top to send the same page to the receipt printer for the daily closeout file.
"How much sales tax do I owe this month?"
Quick filter → Month to Date → Search. Read Total Tax Collected in the Tax Collection Summary section.
"Reconcile the drawer right now"
Run for Today → Search. Read Remaining Cash in Cash Reconciliation. Count the physical cash in the drawer. They should match.
"Which payment method is dominant?"
Read Top Payment Method in KPIs for the answer in one tap. For the full ranking, scan the Payment Method Breakdown grid.
"Multi-store roll-up"
Set Stores dropdown → All Stores → date range → Search. Every section now aggregates across all selected stores.
"How does this period compare to the last?"
Read the change indicators on the Sales Summary cards. Each card shows the percentage change versus the previous comparable period.
"Verify the math"
Compute Net Sales + Total Tax + Total Other Fees and compare to Total Amount Collected. Compute Total Collected − Total Refunded and compare to Total After Refunds.
Important notes
Est. Profit Margin uses a 30% COGS assumption, not actual cost. It's a quick estimate — not a real margin. For actual margin per category use Sales by Category; for per-item margin use the Profit Margin per Item Listing inventory report.
Refunds are deducted at point of refund, not at point of original sale. A refund processed today against an order from last week reduces today's Refunds figure, not last week's Net Sales.
Loyalty Points Redeemed and Discounts are kept separate. LP is broken out because it operates on a different funding model (points expense) than catalog discounts.
Refunds and Store Credit Refunds are separate cards. A customer refunded with cash or to original tender shows up in Refunds. A refund returned as store credit shows up in Store Credit Refunds. Both reduce Net Sales.
Tips are tracked but only included in Total Amount Collected. Tips do not flow into Net Sales — they are passed through to staff.
Total Tax Collected is net of tax refunded. If a sale is refunded, the tax on that sale is also refunded.
Non-Cash Adjustment shows up in two places — as a fee in Additional Fees & Charges (the money collected) and as a credit/debit transaction amount in Payment Method Breakdown.
Total Collected vs Total After Refunds matter for two different purposes. Total Collected is the period's gross intake; Total After Refunds is what you actually kept. For reconciling against payment-processor settlements, use Total Collected.
Filters do not auto-apply. Changing dates or store selection requires tapping Search.
The new UI is a staged rollout. Merchants on the legacy layout see the same underlying numbers in a different visual.
KPI calculation reference
For the developer-curious — exact formulas used to compute each KPI:
|
KPI |
Formula |
Edge case |
|---|---|---|
|
Average Transaction Value |
|
No transactions → ATV = 0 |
|
Refund Rate |
|
Total Collected = 0 → Refund Rate = 0 |
|
Estimated Profit Margin |
|
Gross Sales Subtotal = 0 → Profit Margin = 0 |
|
Top Payment Method |
Payment method with the maximum |
No data → "-" |