
The Item Refund Report is the line-item-level counterpart to the Order Refund Report. Where the Order Refund Report shows one row per refunded order with the payment-channel breakdown, the Item Refund Report shows one row per refunded product — the actual SKUs that came back across the counter, who refunded them, when, why, and what they were worth.
Use this report when the question is about products, not orders: which SKUs are being returned most often, whether a single brand is showing up repeatedly in Out of Stock refunds, whether a category has a refund spike that signals a damaged delivery, or whether a specific product needs to be pulled from the floor entirely.
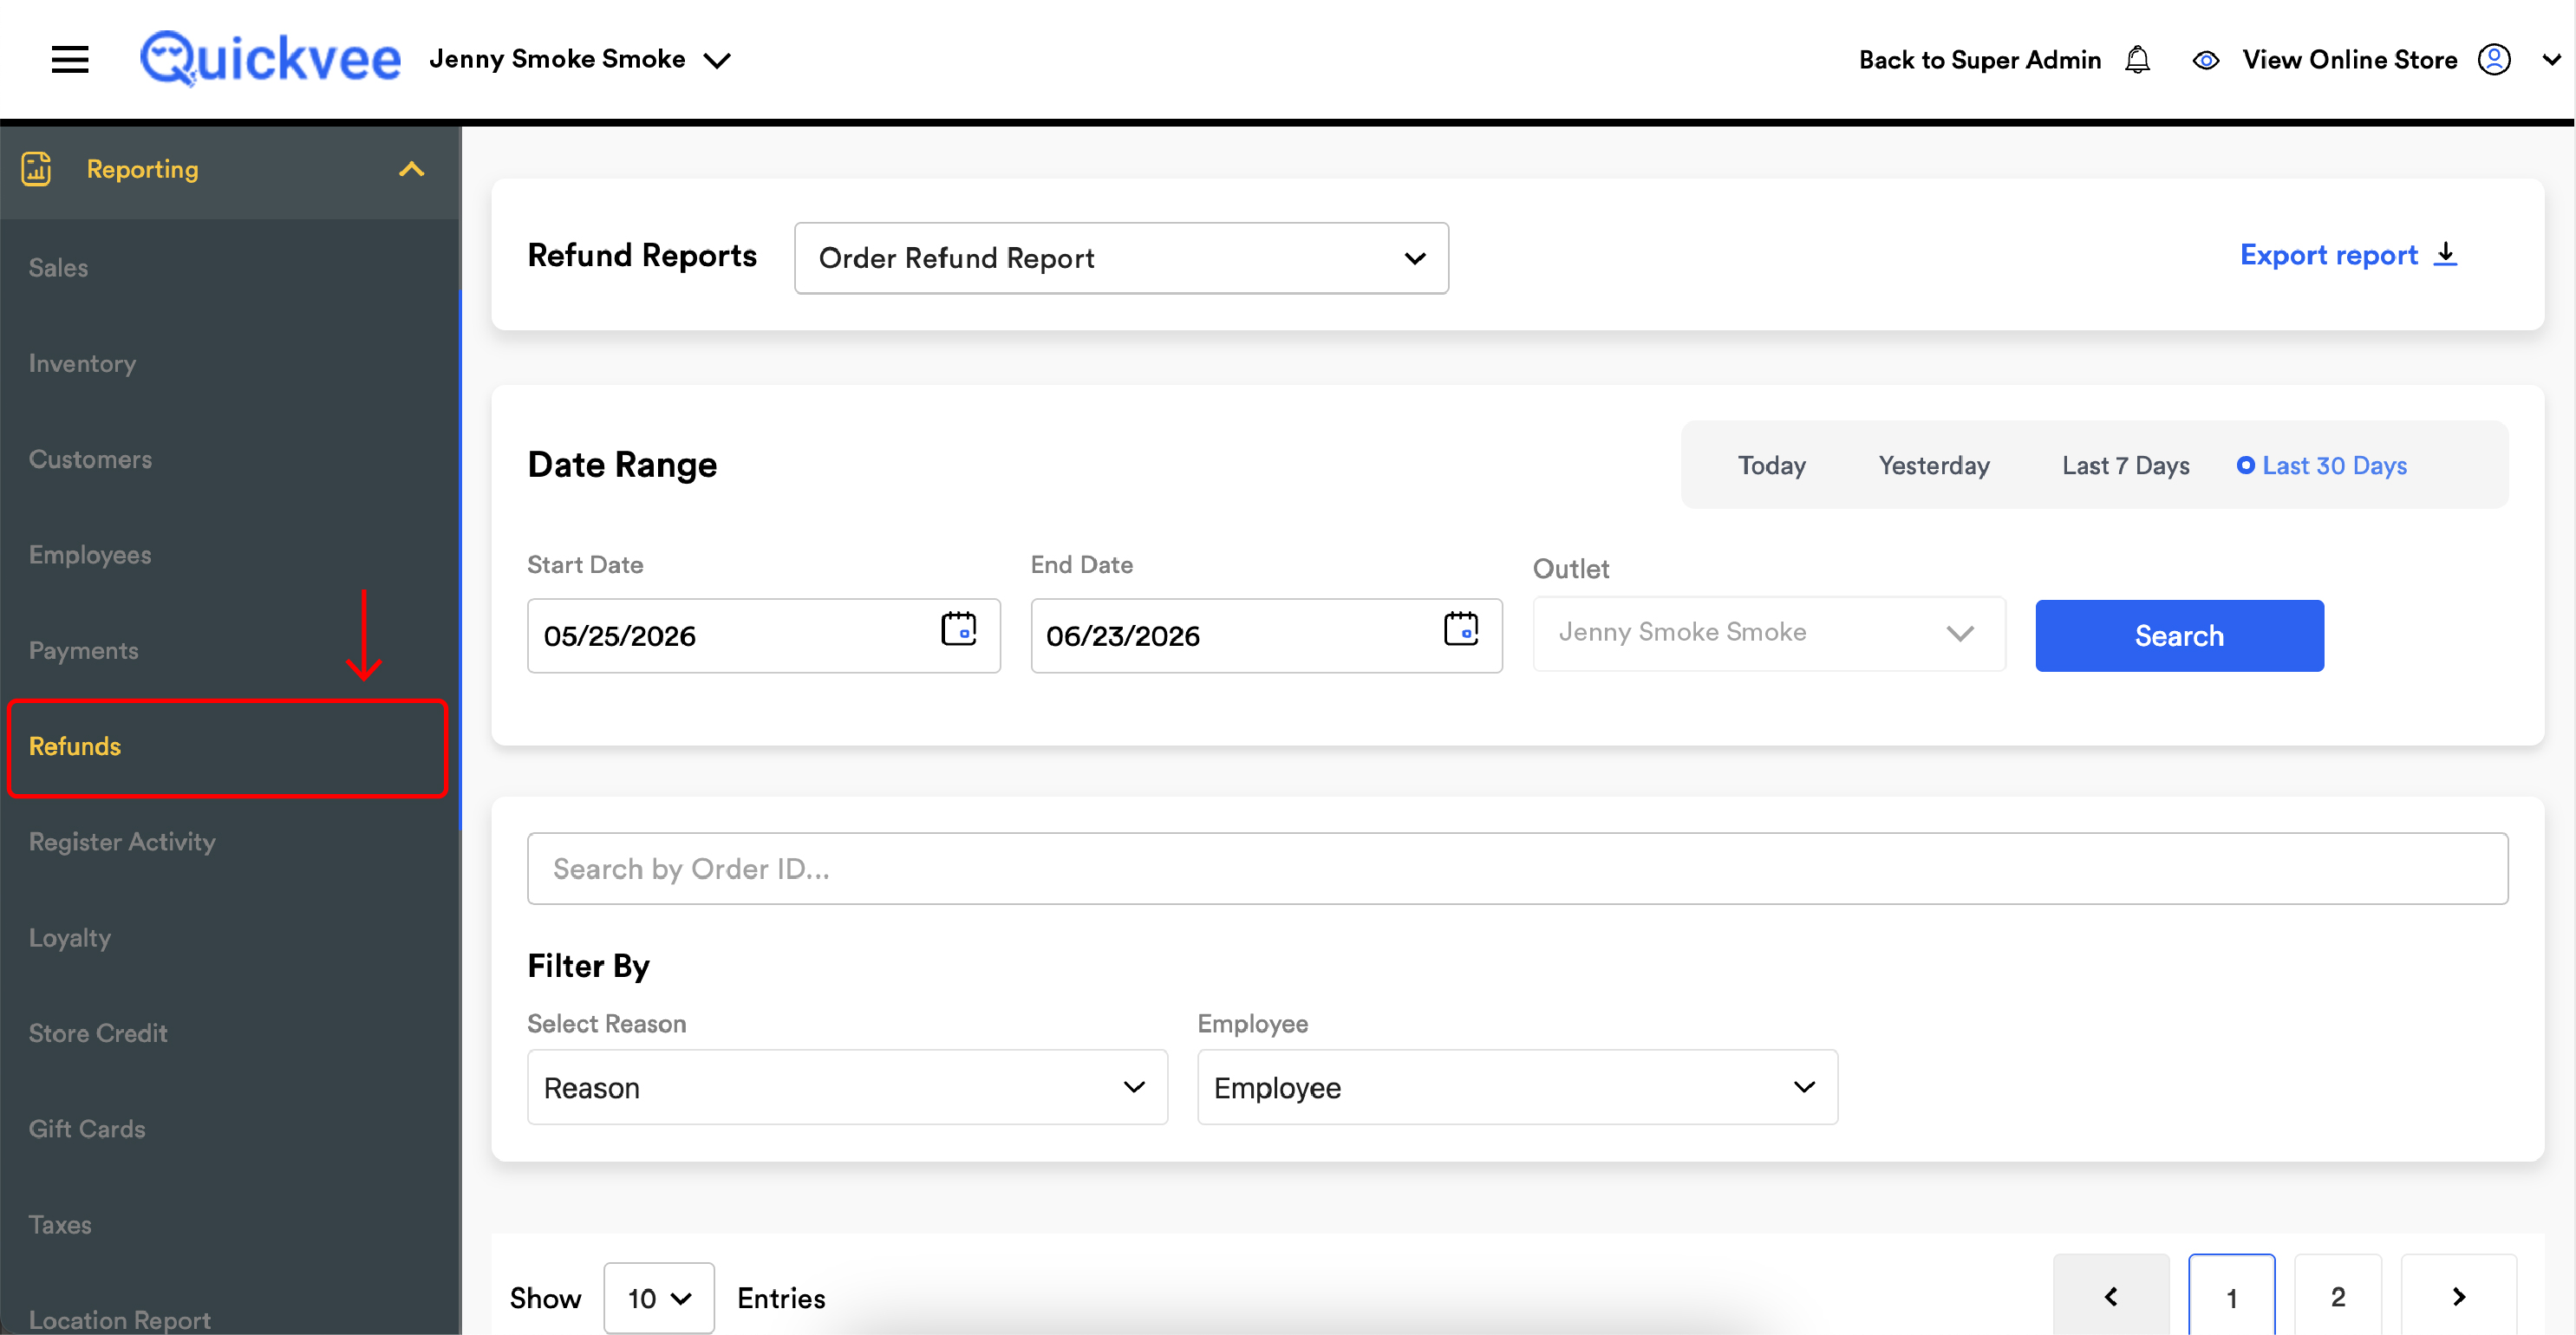
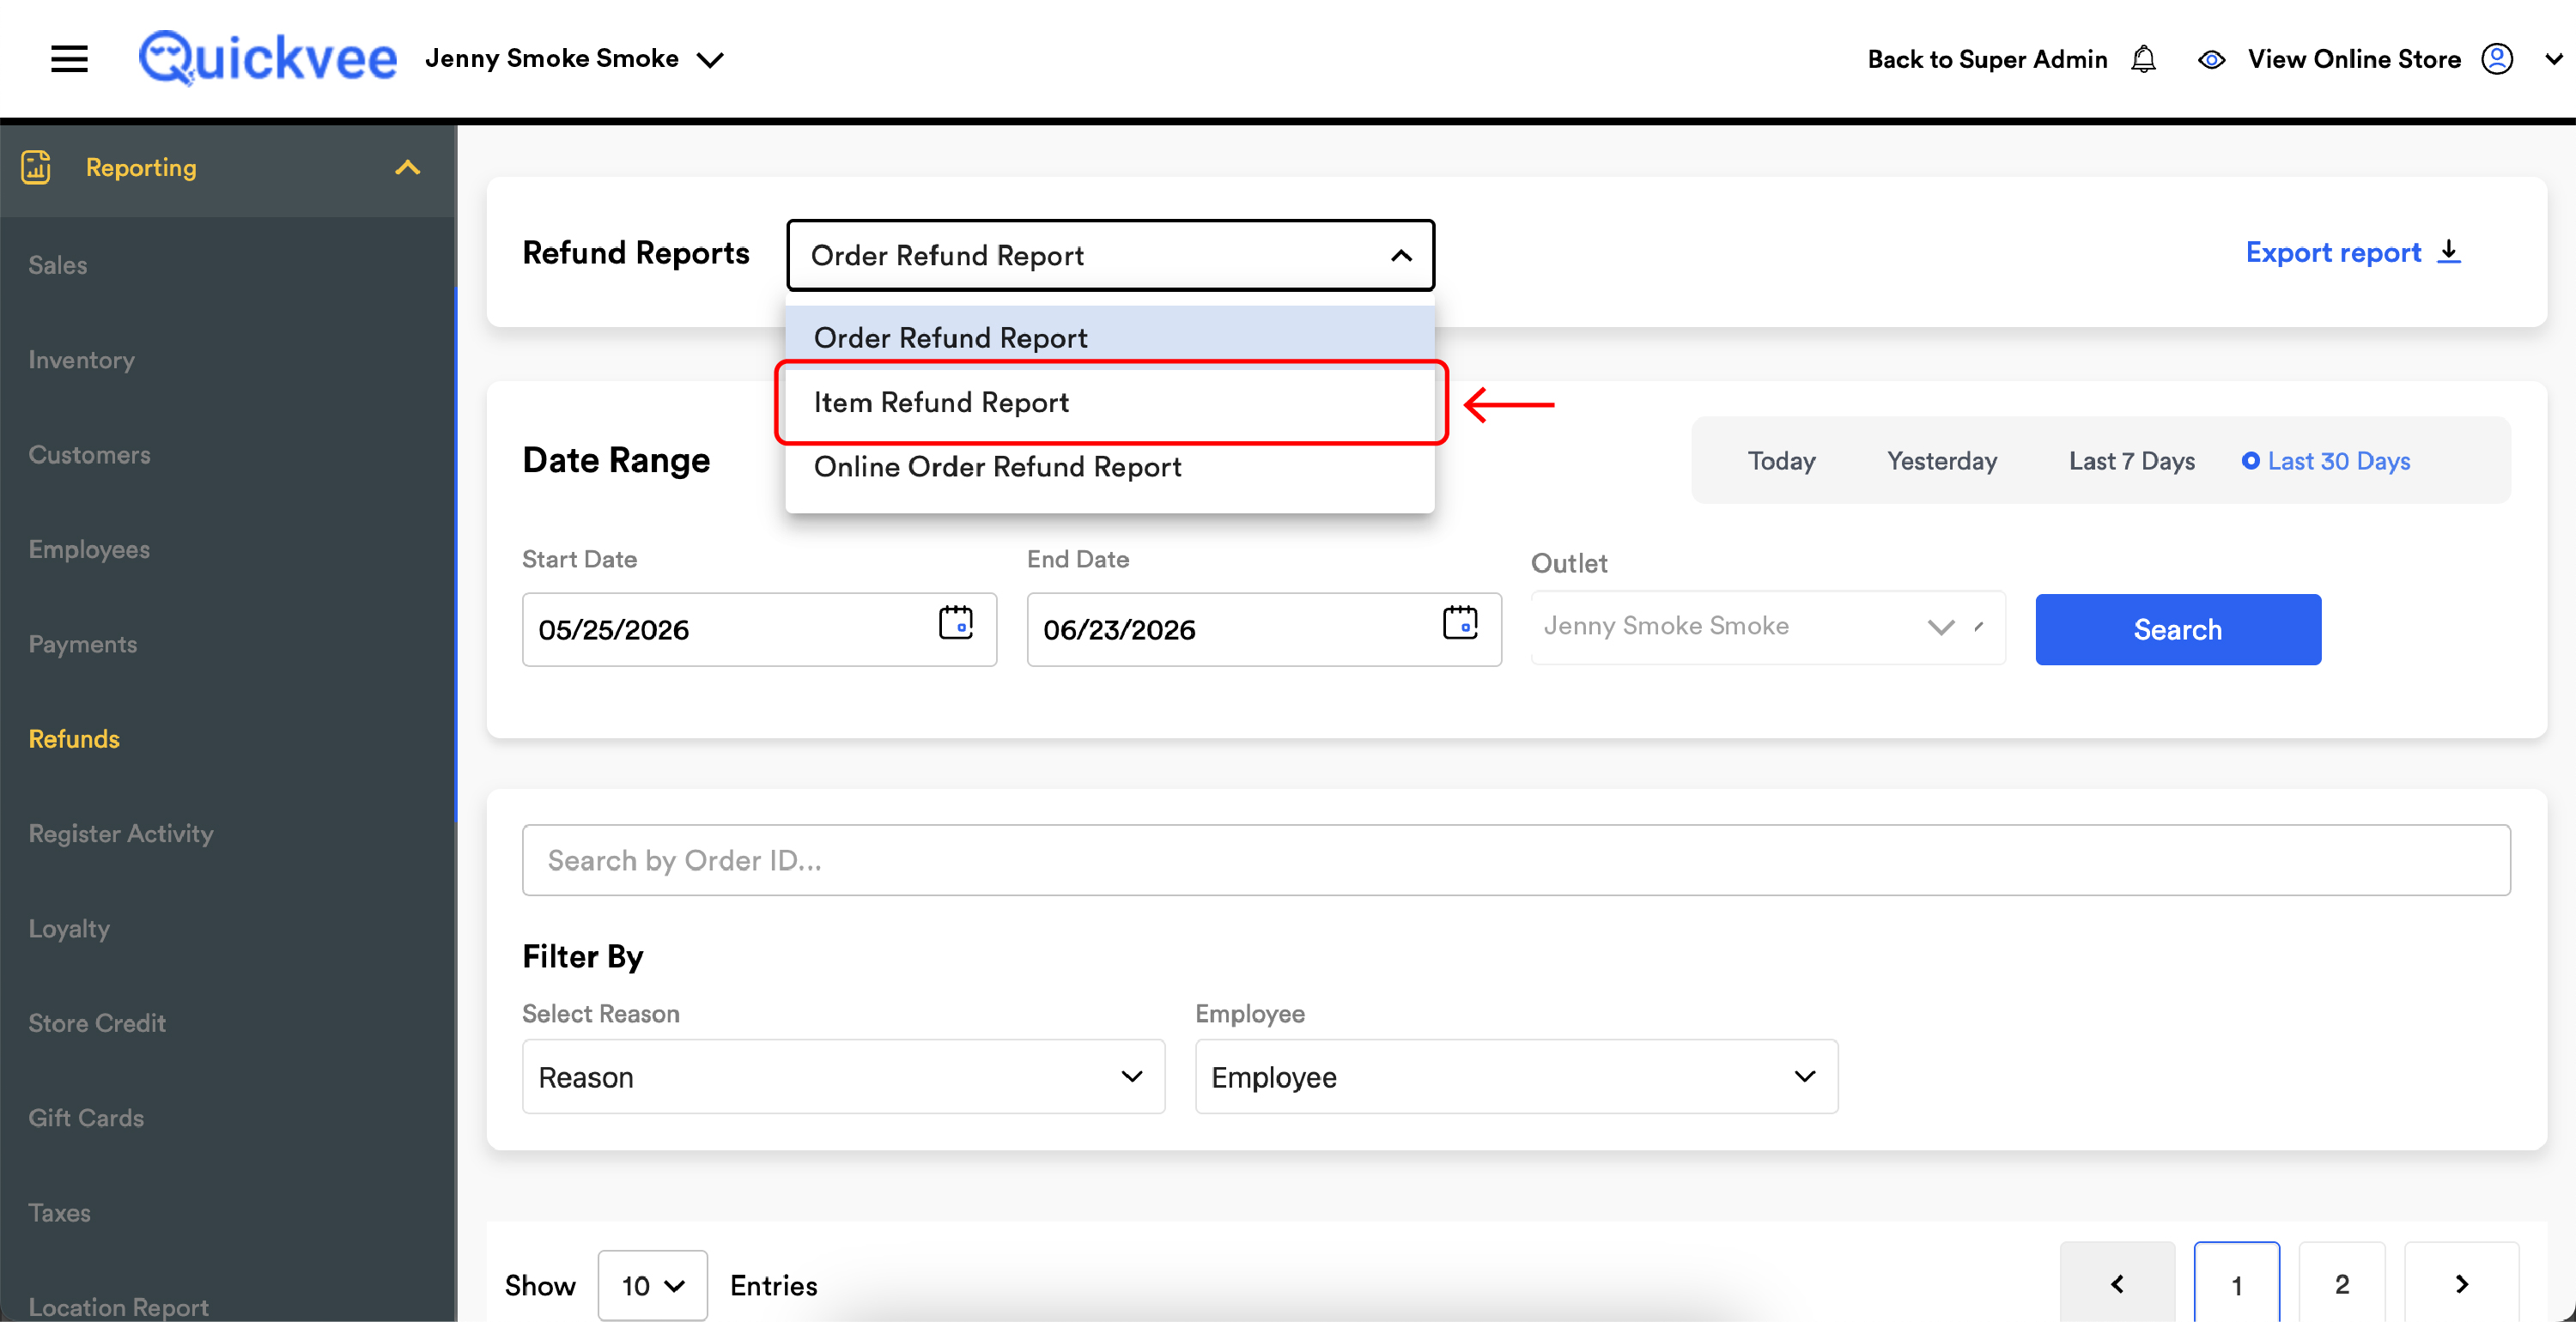
Access path: Sign in to your merchant backend → side menu → Reporting → Refunds → and from the Refund Reports dropdown at the top of the page select Item Refund Report.
Running the report
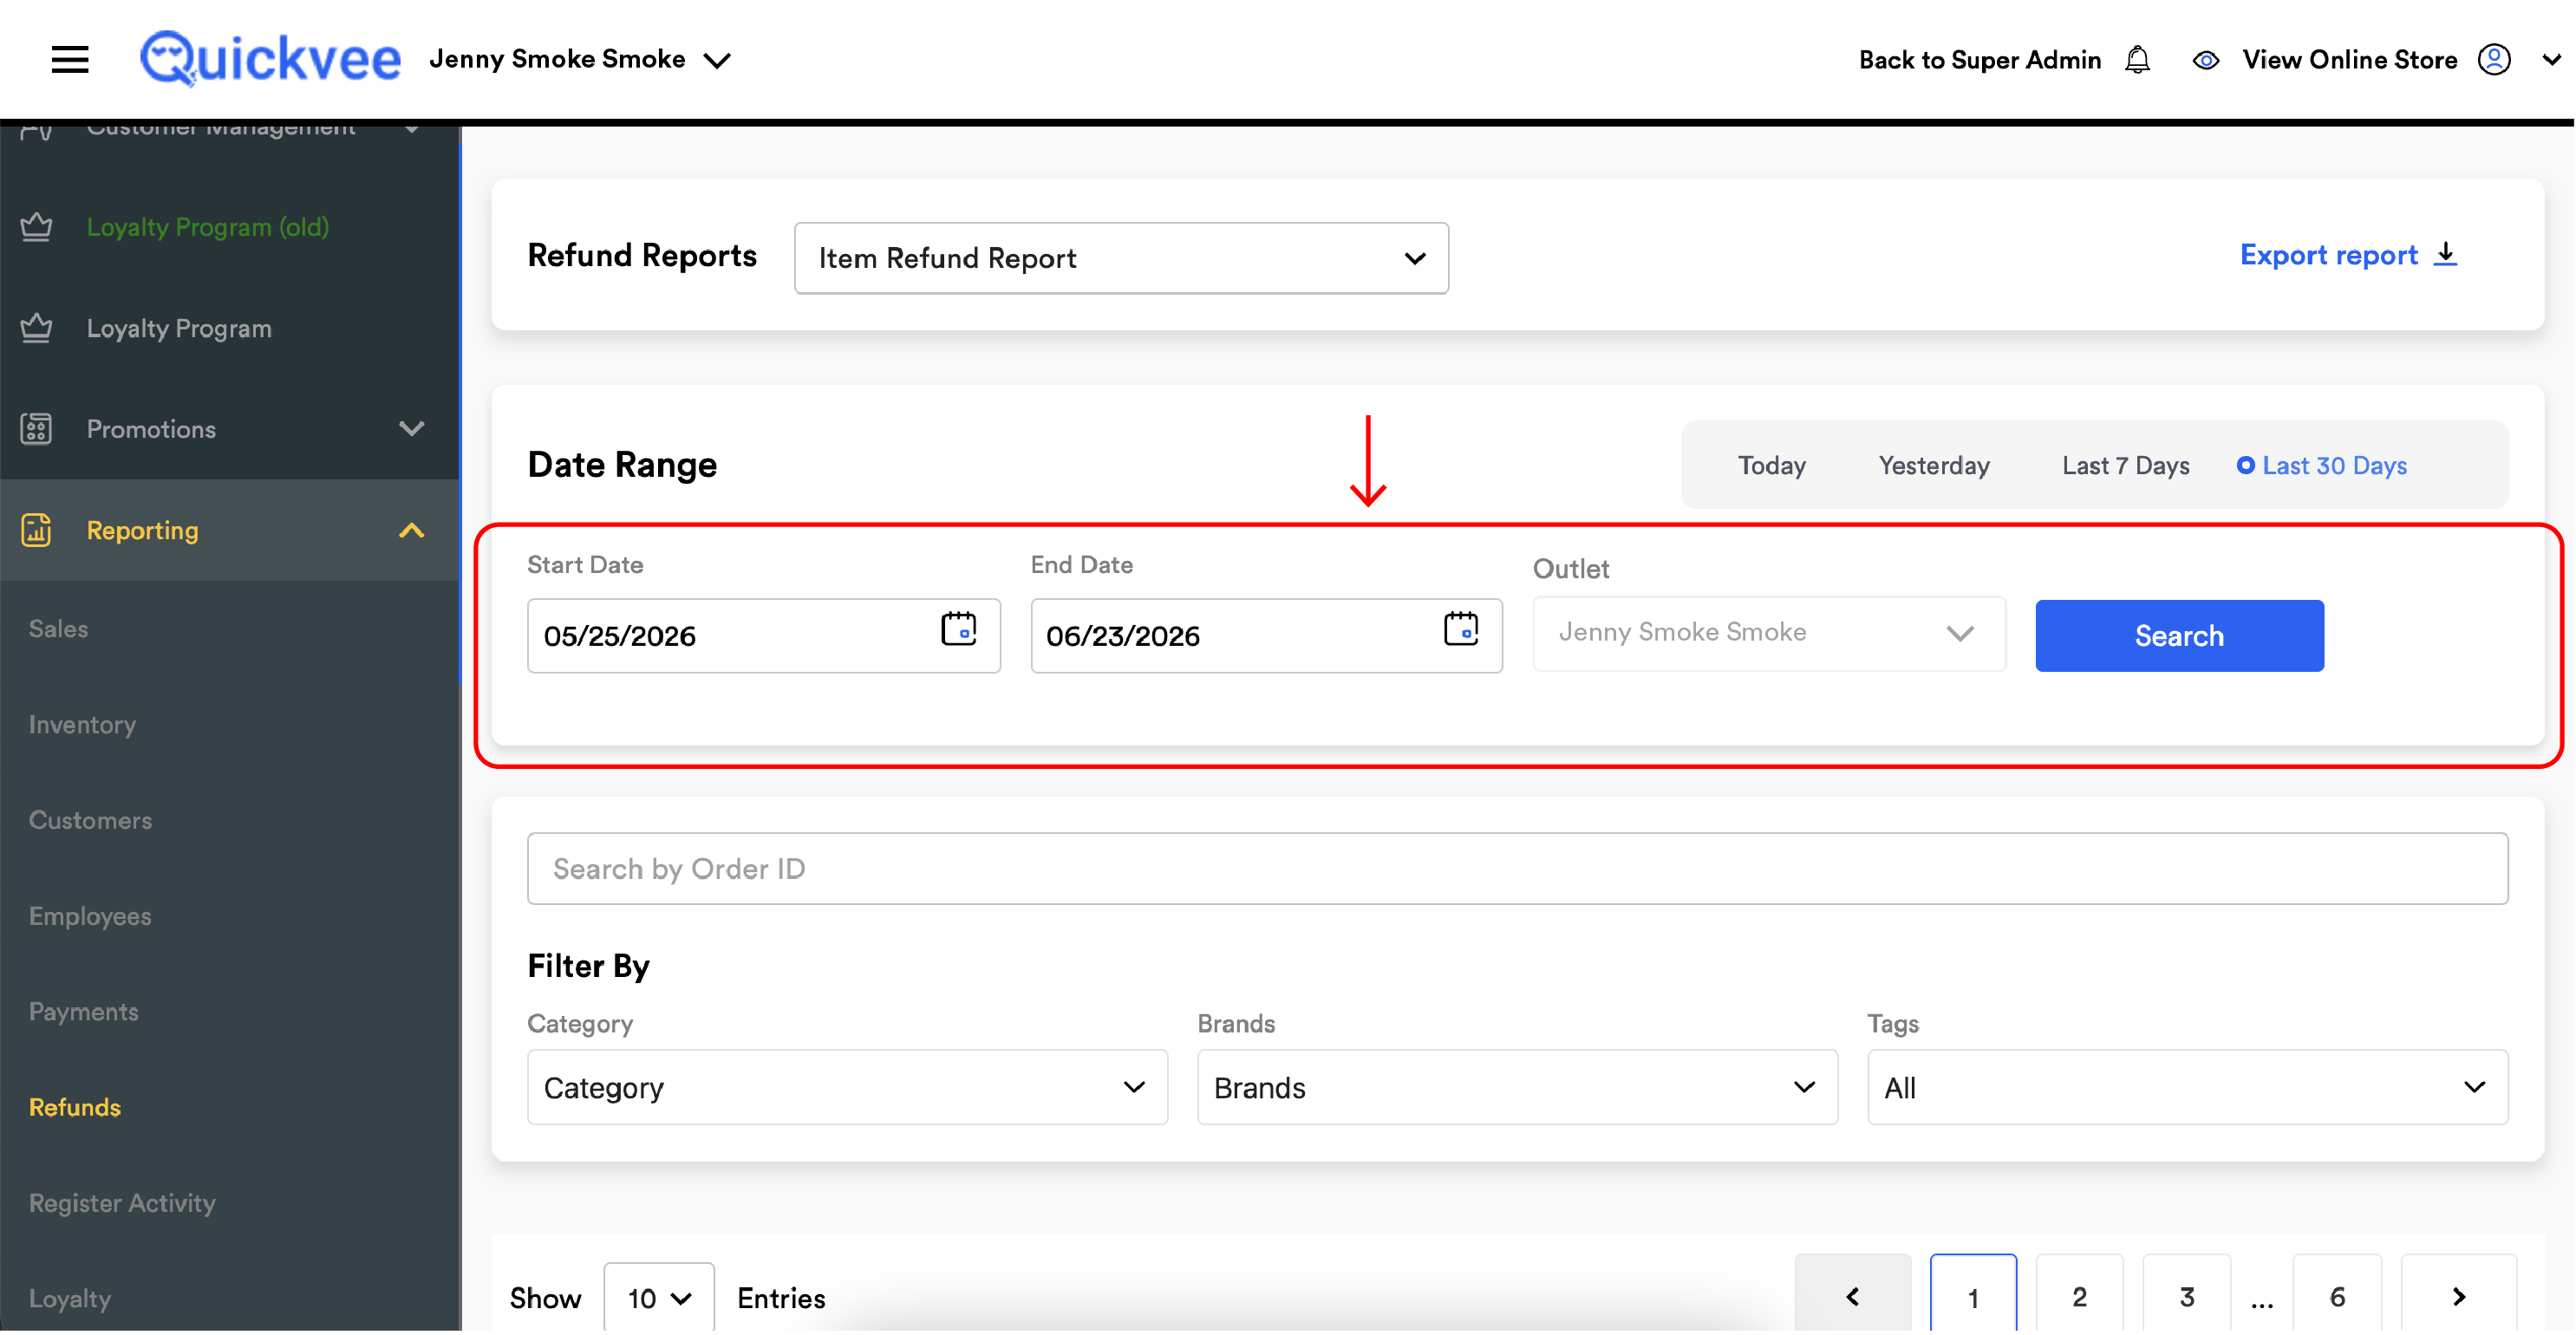
Date Range
|
Control |
What it does |
|---|---|
|
Start Date |
The first day of the date range. |
|
End Date |
The last day of the date range. |
|
Outlet |
When your account has more than one store location, the outlet dropdown picks which store the report runs against. |
|
Search (blue) |
Runs the report against the selected date range and outlet. |
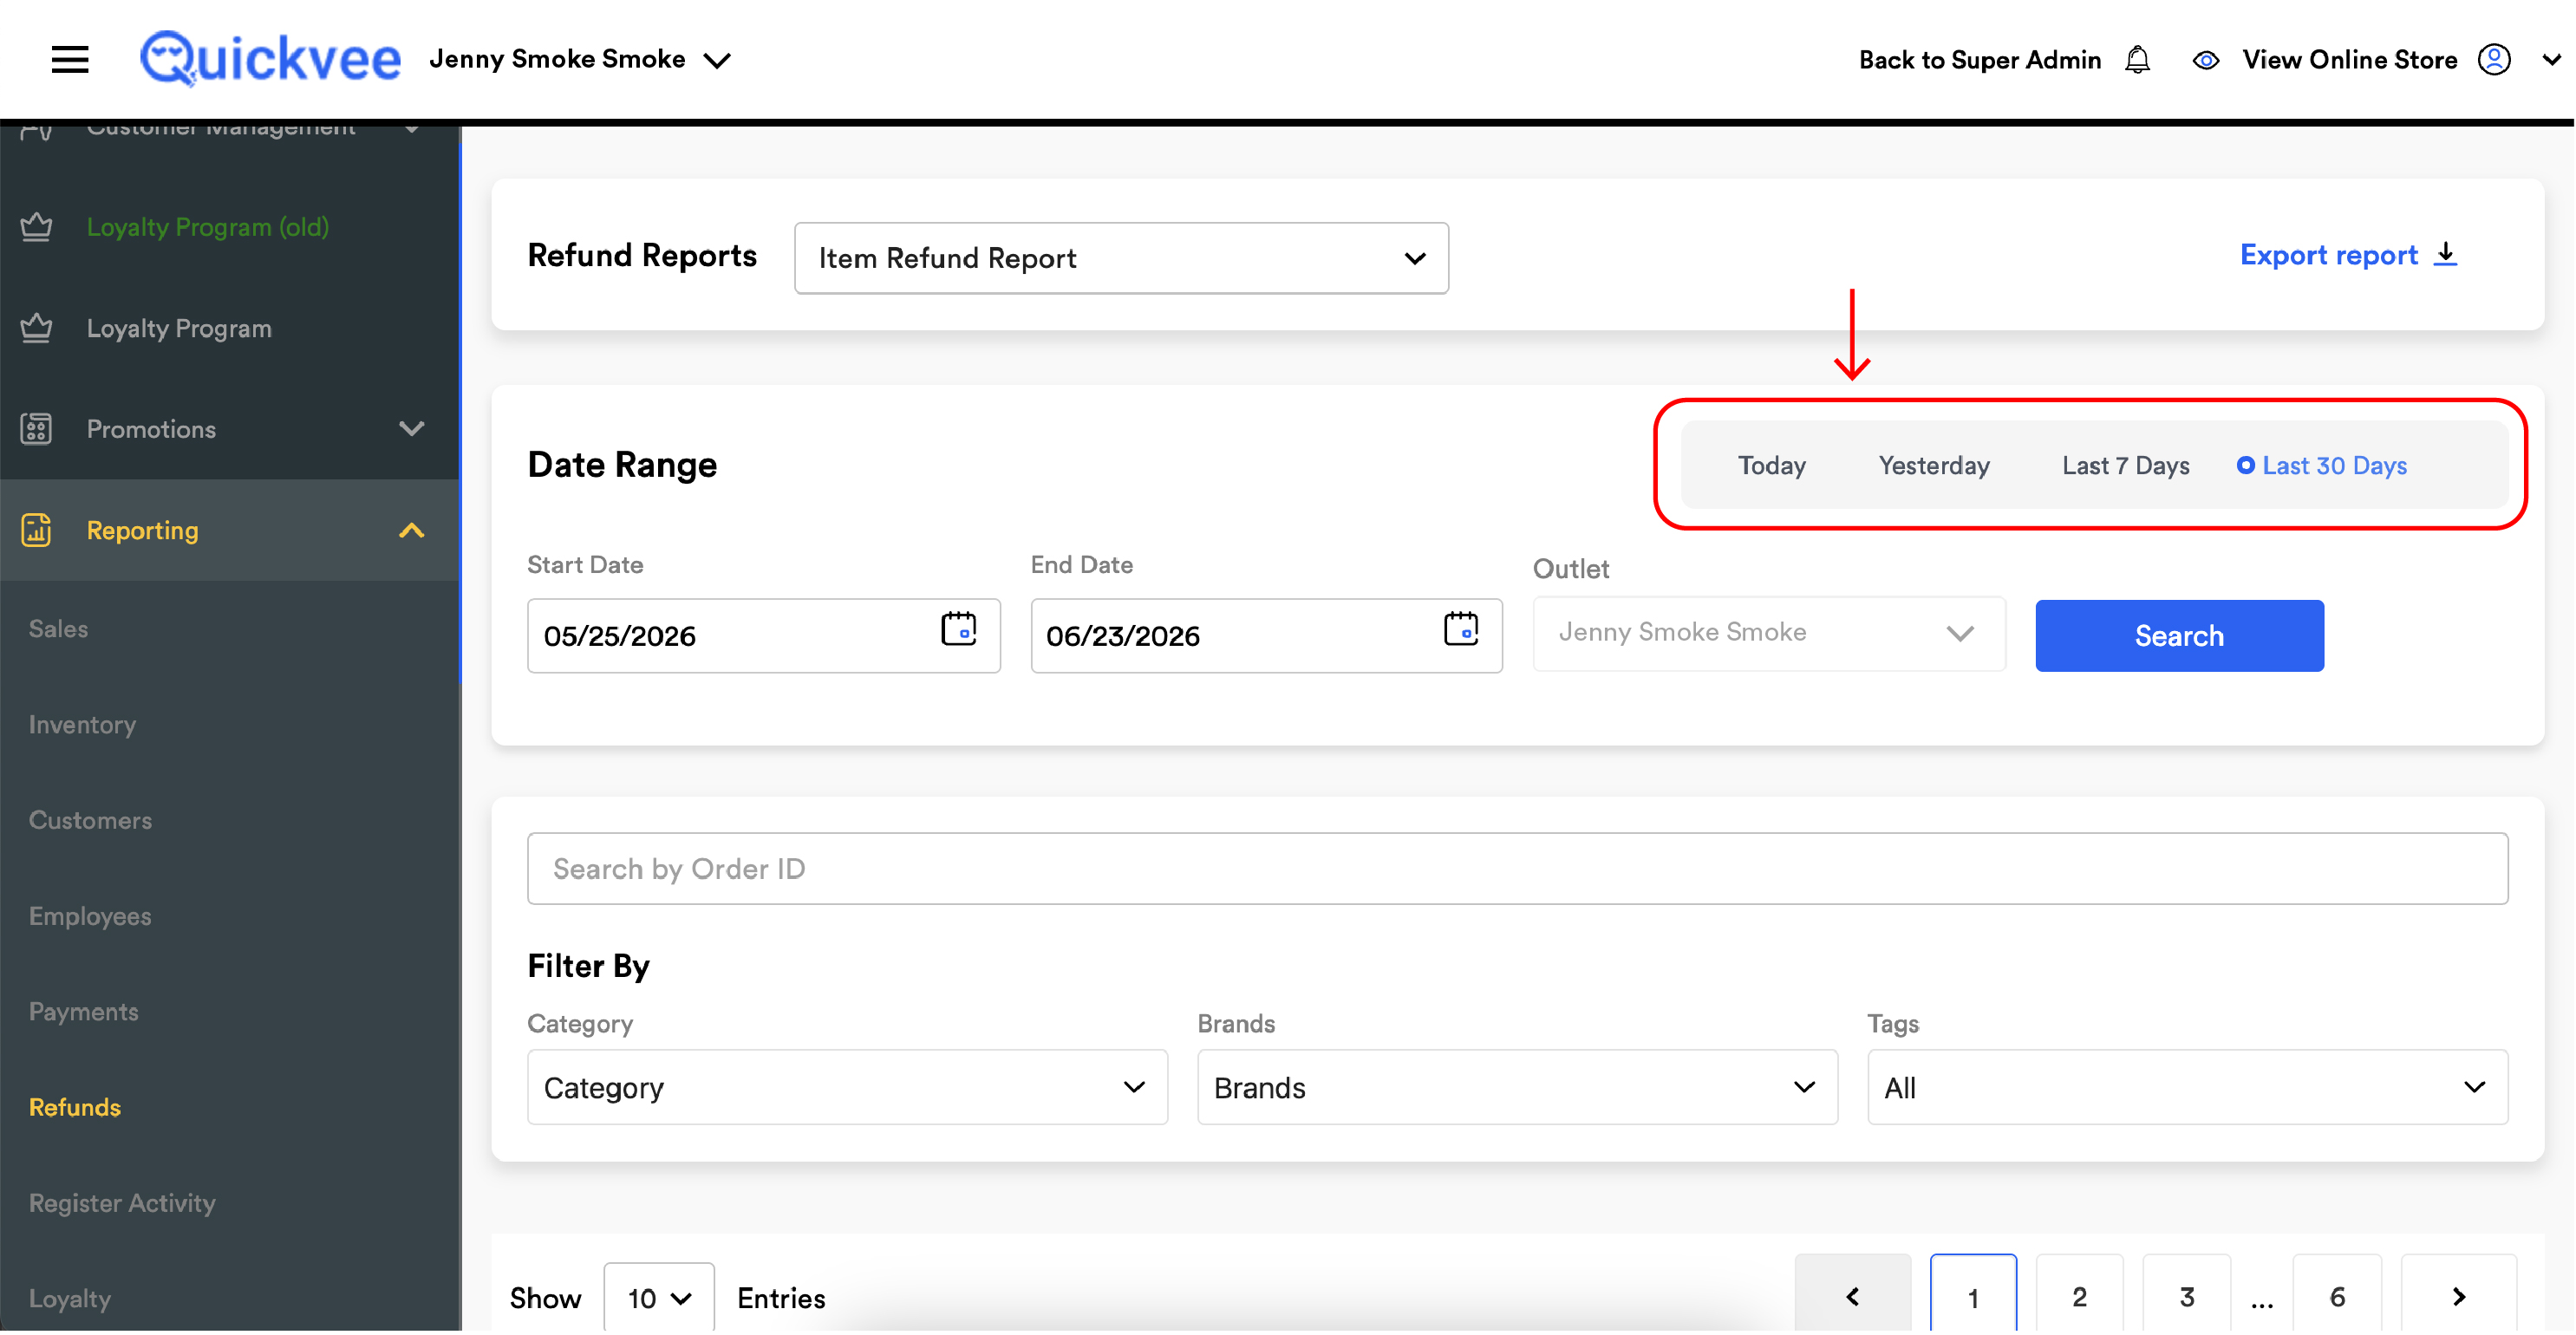
Quick range buttons
Four buttons let you skip the calendar picker: Today, Yesterday, Last 7 Days, Last 30 Days.
Search by Order ID
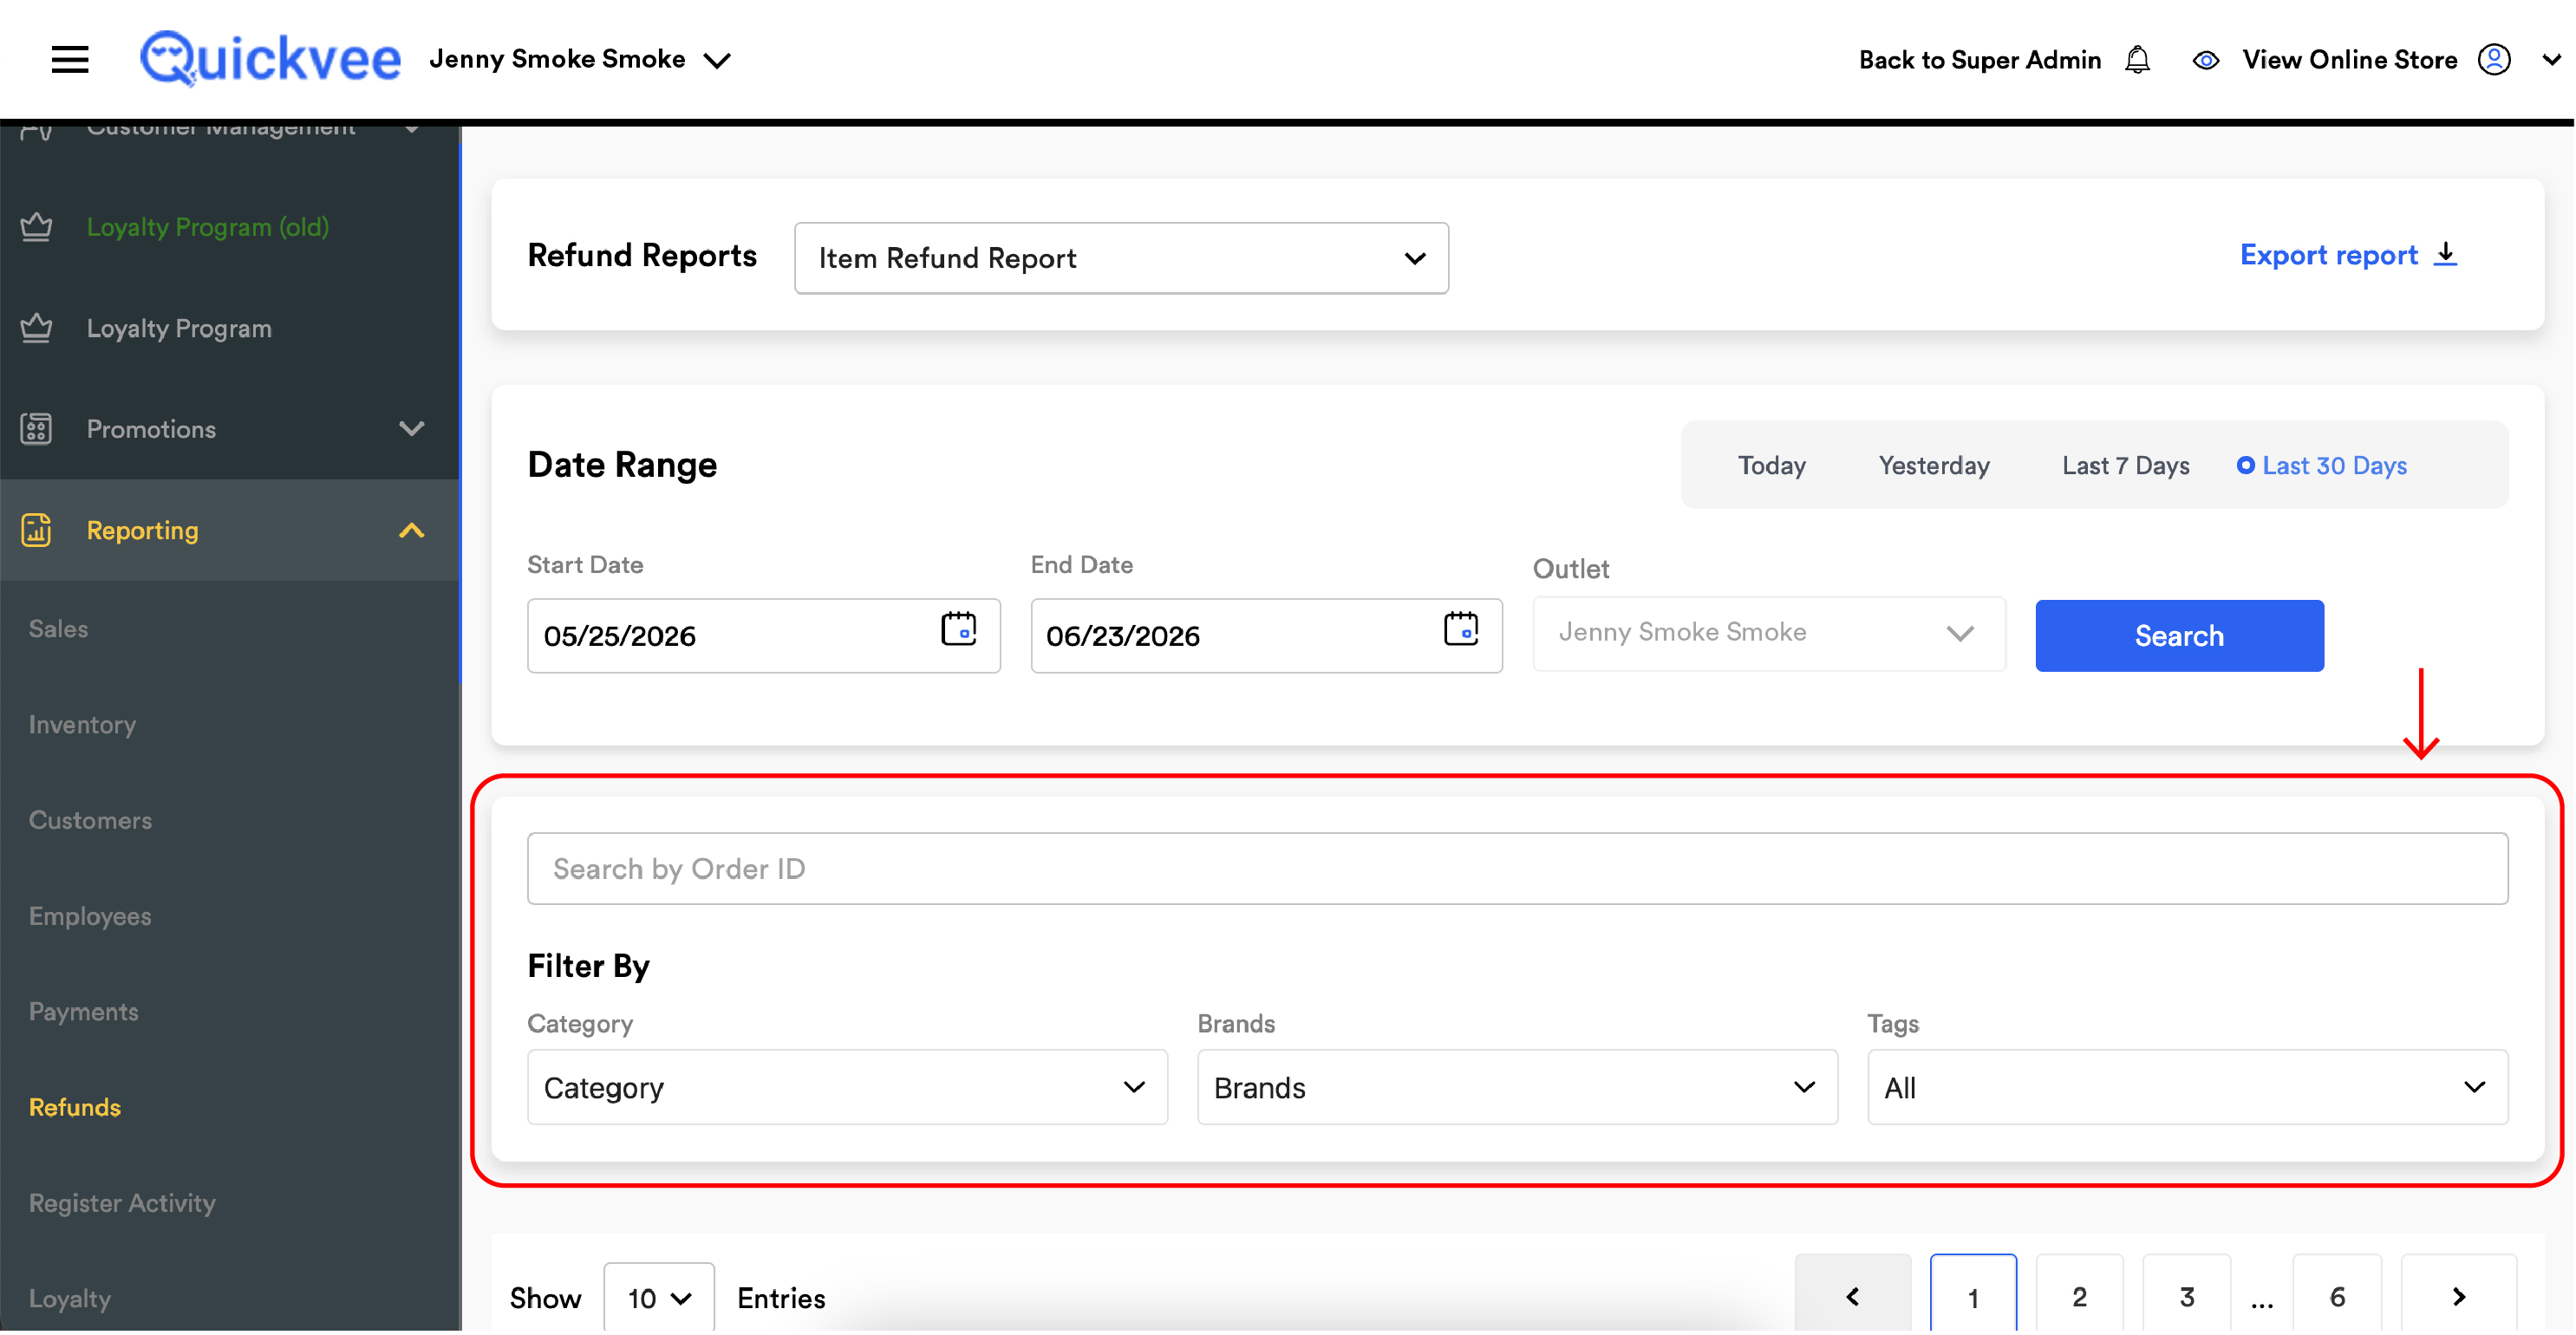
Below the Date Range section, a single Search by Order ID field accepts a full or partial Order ID. Use it to drill from an order in your inbox or from a register receipt straight to the items that were refunded out of that order. The search works in combination with the date range and Filter By filters.
Filter By
The Filter By panel focuses on product-level attributes — different from the Order Refund Report (which filters by Reason and Employee) because here you're slicing the catalog, not the cashier or reason.
|
Filter |
What it does |
|---|---|
|
Category |
Dropdown of every category in your store. Pick one to see only refunded items from that category — for example, Disposables to audit vape returns. |
|
Brands |
Dropdown of every brand in your catalog. Pick one to see only refunded items from that brand — useful when a specific brand suddenly spikes. |
|
Tags |
Dropdown of every tag in your store. Pick one to see only refunded items carrying that tag — handy for promotional groups, clearance lines, or any custom internal grouping. |
Export report
The Export report link at the top-right downloads the full filtered report as a spreadsheet.
Reading the report
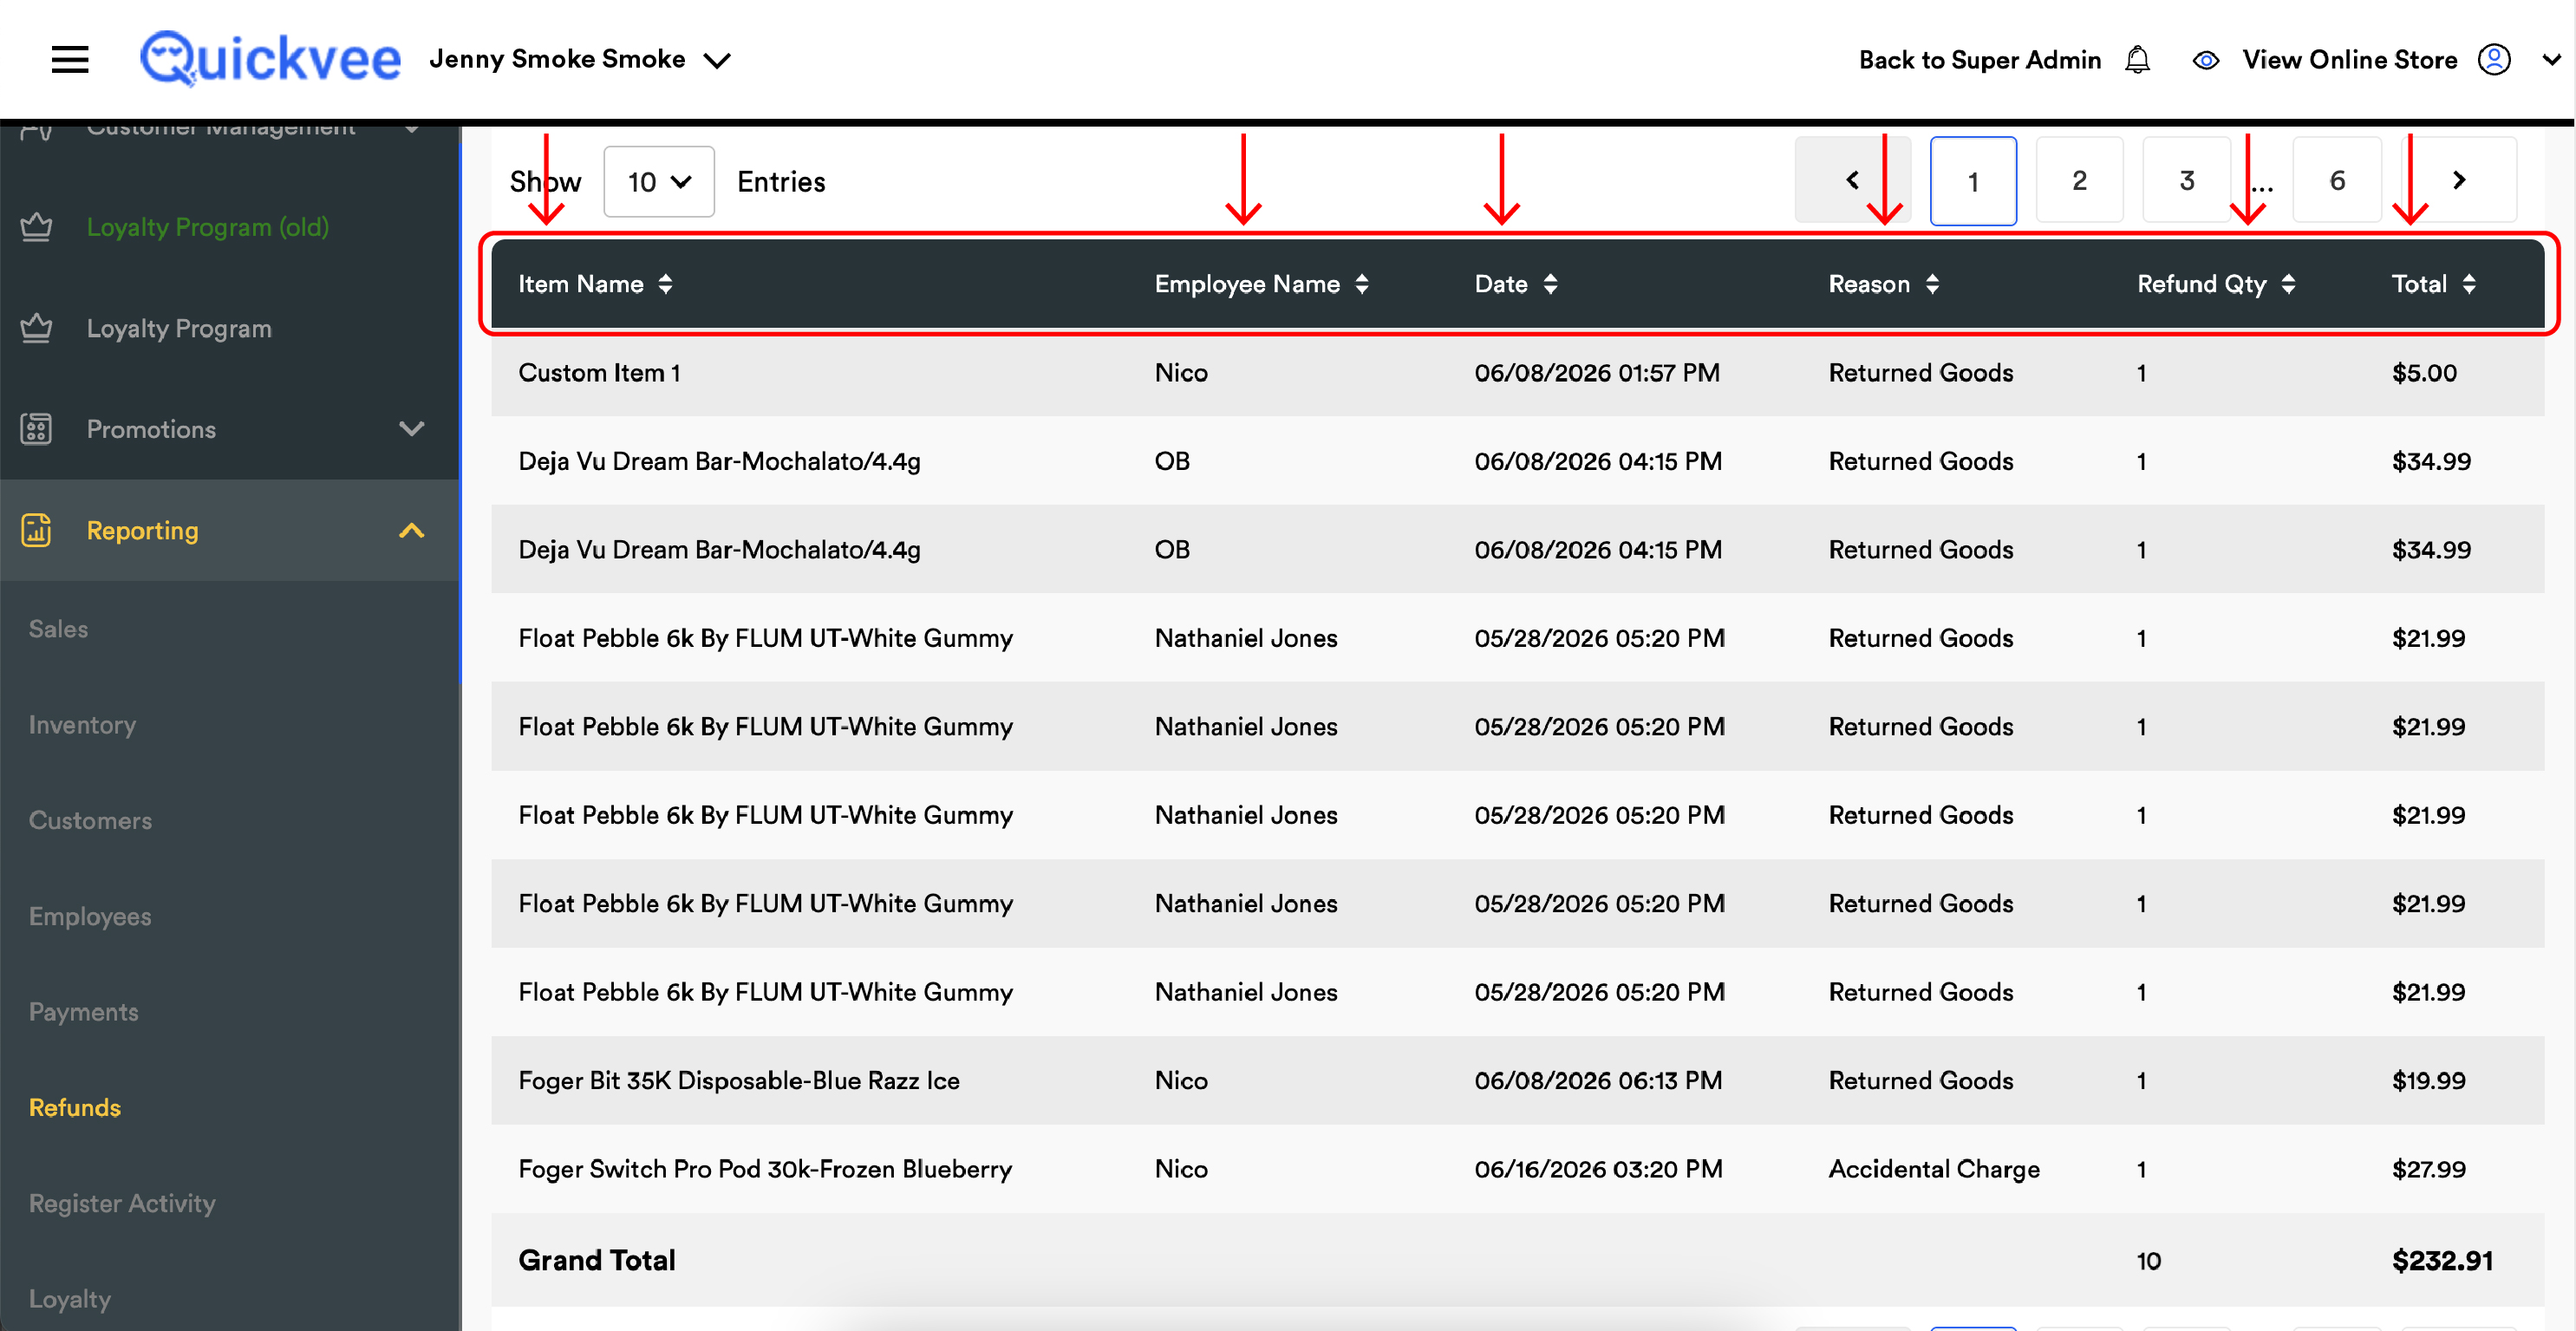
The report is a single flat table where each row is one refunded product. The columns are:
|
Column |
What it shows |
|---|---|
|
Item Name (sortable) |
The product or variant name as it appears in your catalog (e.g. Lost Mary Nera Fullview Pod 70k-Miami Mint, VELO Plus Nicotine Pouches-Peppermint/9mg). Sortable A→Z or Z→A. |
|
Employee Name (sortable) |
The name of the cashier who processed the refund. Null or blank means the refund was processed by a deleted employee account. |
|
Date (sortable) |
The date and time the refund was processed, formatted MM/DD/YYYY HH:MM AM/PM. |
|
Reason (sortable) |
The refund reason picked at the time of refund — e.g. Returned Goods, Out of Stock, Damaged, Wrong Item. |
|
Refund Qty (sortable) |
The number of units of this product that were refunded in this transaction. |
|
Total (sortable) |
The dollar value of the refunded units — typically the line item's pre-tax value. |
One refunded order can produce multiple rows here. If a customer returns three different products in a single transaction, the Order Refund Report shows that as one row, while the Item Refund Report shows it as three — one per product. This is intentional: the two reports answer different questions about the same refund event.
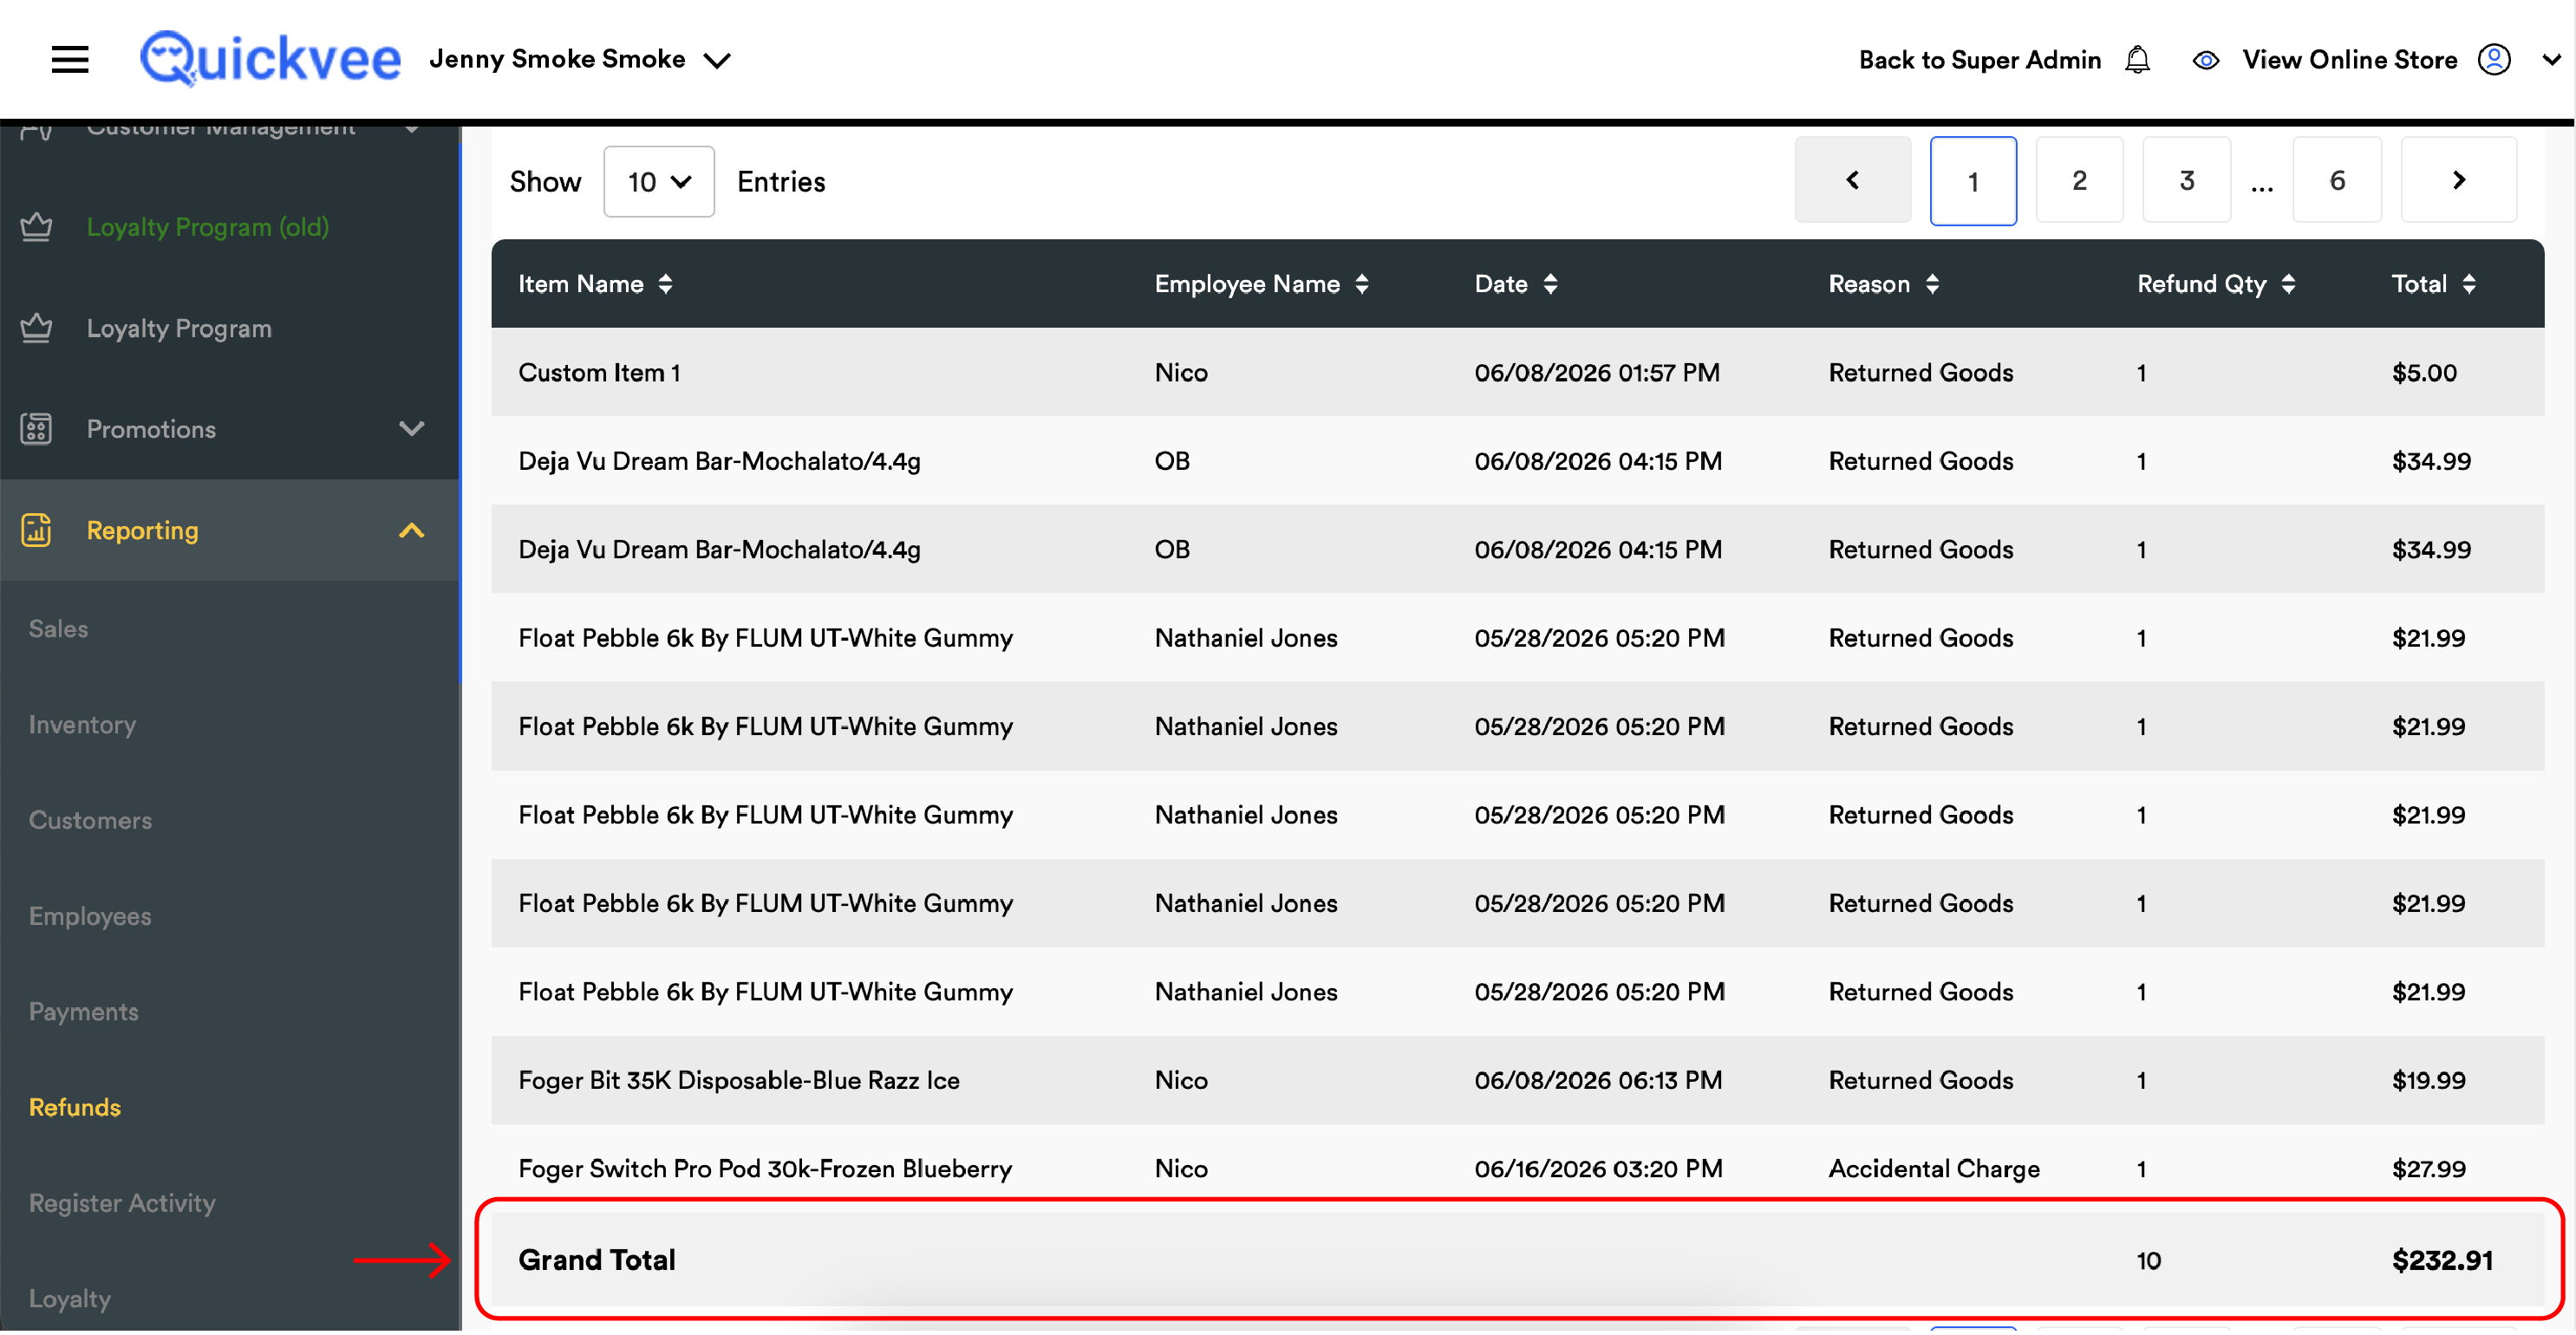
The Grand Total
|
Column |
Grand Total shows |
|---|---|
|
Refund Qty |
The total units refunded across every product row — the headline unit count for the period. |
|
Total |
The total dollar value of refunded items in the period. |
The Grand Total respects every active filter. Filtering to Category = Disposables gives you the total Disposable units and dollar value refunded; switching to Brands = Lost Mary narrows further.
Item Refund vs Order Refund — what's the difference
The two refund reports cover the same refund events from different angles:
|
Dimension |
Order Refund Report |
Item Refund Report |
|---|---|---|
|
Row granularity |
One row per refunded order |
One row per refunded product |
|
Filters |
Reason, Employee |
Category, Brands, Tags |
|
Payment channel breakdown |
Yes — Debit / Credit / Cash / LP / SC / NCA / Tip |
No — single Total column |
|
Includes tax / tip / surcharge |
Yes — Total includes everything refunded to the customer |
Typically just the item value |
|
Best for |
Refund reconciliation, payment audit, employee patterns |
Product audit, category trends, brand-level returns |
Totals between the two reports for the same period will not match exactly — because each report sums a different thing. The Order Refund Report's Grand Total includes tax, tip, and NCA portions; the Item Refund Report's Grand Total is the items themselves. Use whichever number fits the question you're answering.
How to read unusual rows
|
Pattern |
What it usually means |
|---|---|
|
Same item appearing repeatedly within a short period |
Either a bad batch or a product the store should consider pulling. Cross-check against vendor and lot info. |
|
All refunds from one brand in a single day |
A vendor-side issue — bad delivery, recall, manufacturing defect. Worth a vendor call. |
|
High Out of Stock refund volume on a popular item |
Inventory wasn't updated to Disable fast enough when stock ran out. Train staff to disable products from the inventory page when shelves go bare. |
|
Refund Qty > 1 on a row |
Customer returned multiple units of the same product in a single transaction. |
|
Employee = Null |
Refund was processed by a deleted employee account — possible audit signal. |
|
Same Item Name appearing across multiple Order IDs |
The product is being returned repeatedly across different customers — strong signal to investigate. |
What to do with the report
|
Question |
How to answer it |
|---|---|
|
Which product is being returned most often? |
Run the period, leave filters empty, sort by Item Name to group, or export and pivot in a spreadsheet by Item Name. |
|
Are returns spiking on a specific brand? |
Filter Brands = (brand name), compare Grand Total Refund Qty across periods. |
|
Did we have a bad batch of disposables this week? |
Filter Category = Disposables, quick-range Last 7 Days, run. Scan for clusters by Item Name or by Date. |
|
How many Out of Stock refunds happened, and on what products? |
Run the period, sort by Reason, focus on the Out of Stock rows. Or filter by Reason in the Order Refund Report and cross-reference. |
|
Should we discontinue this SKU? |
Run the period over the last 30–90 days, filter to the product or brand, look at the Grand Total Refund Qty relative to sold quantity. |
|
Are tagged promotional items coming back more than expected? |
Filter Tags = (your promo tag), compare against expected refund rate. |
Notes
-
The report covers the selected outlet only. Switch the Outlet dropdown and re-run to compare across locations.
-
Refunds processed at the register and from the web backend both appear here — there is no separate column distinguishing the source.
-
Pagination at the bottom controls how many rows show per page (10 by default — adjust via the Show ... Entries dropdown).
-
For the payment-channel breakdown of a refund (cash vs. card vs. store credit vs. loyalty points), switch to the Order refund report in the same Refund Reports dropdown.
-
This report does not include tax or tip components in the Total column — those live with the order-level view.