
The Discounts Report breaks down every discount that reduced order totals during the selected date range — by discount type (Custom, Loyalty Points, Mix N' Match, Coupon, BOGO) — and shows how often each was applied, how much each took off the top, and what share of gross sales each represents.
Access path: Quickvee Web → Reporting → Sales Reports → select Discounts Report
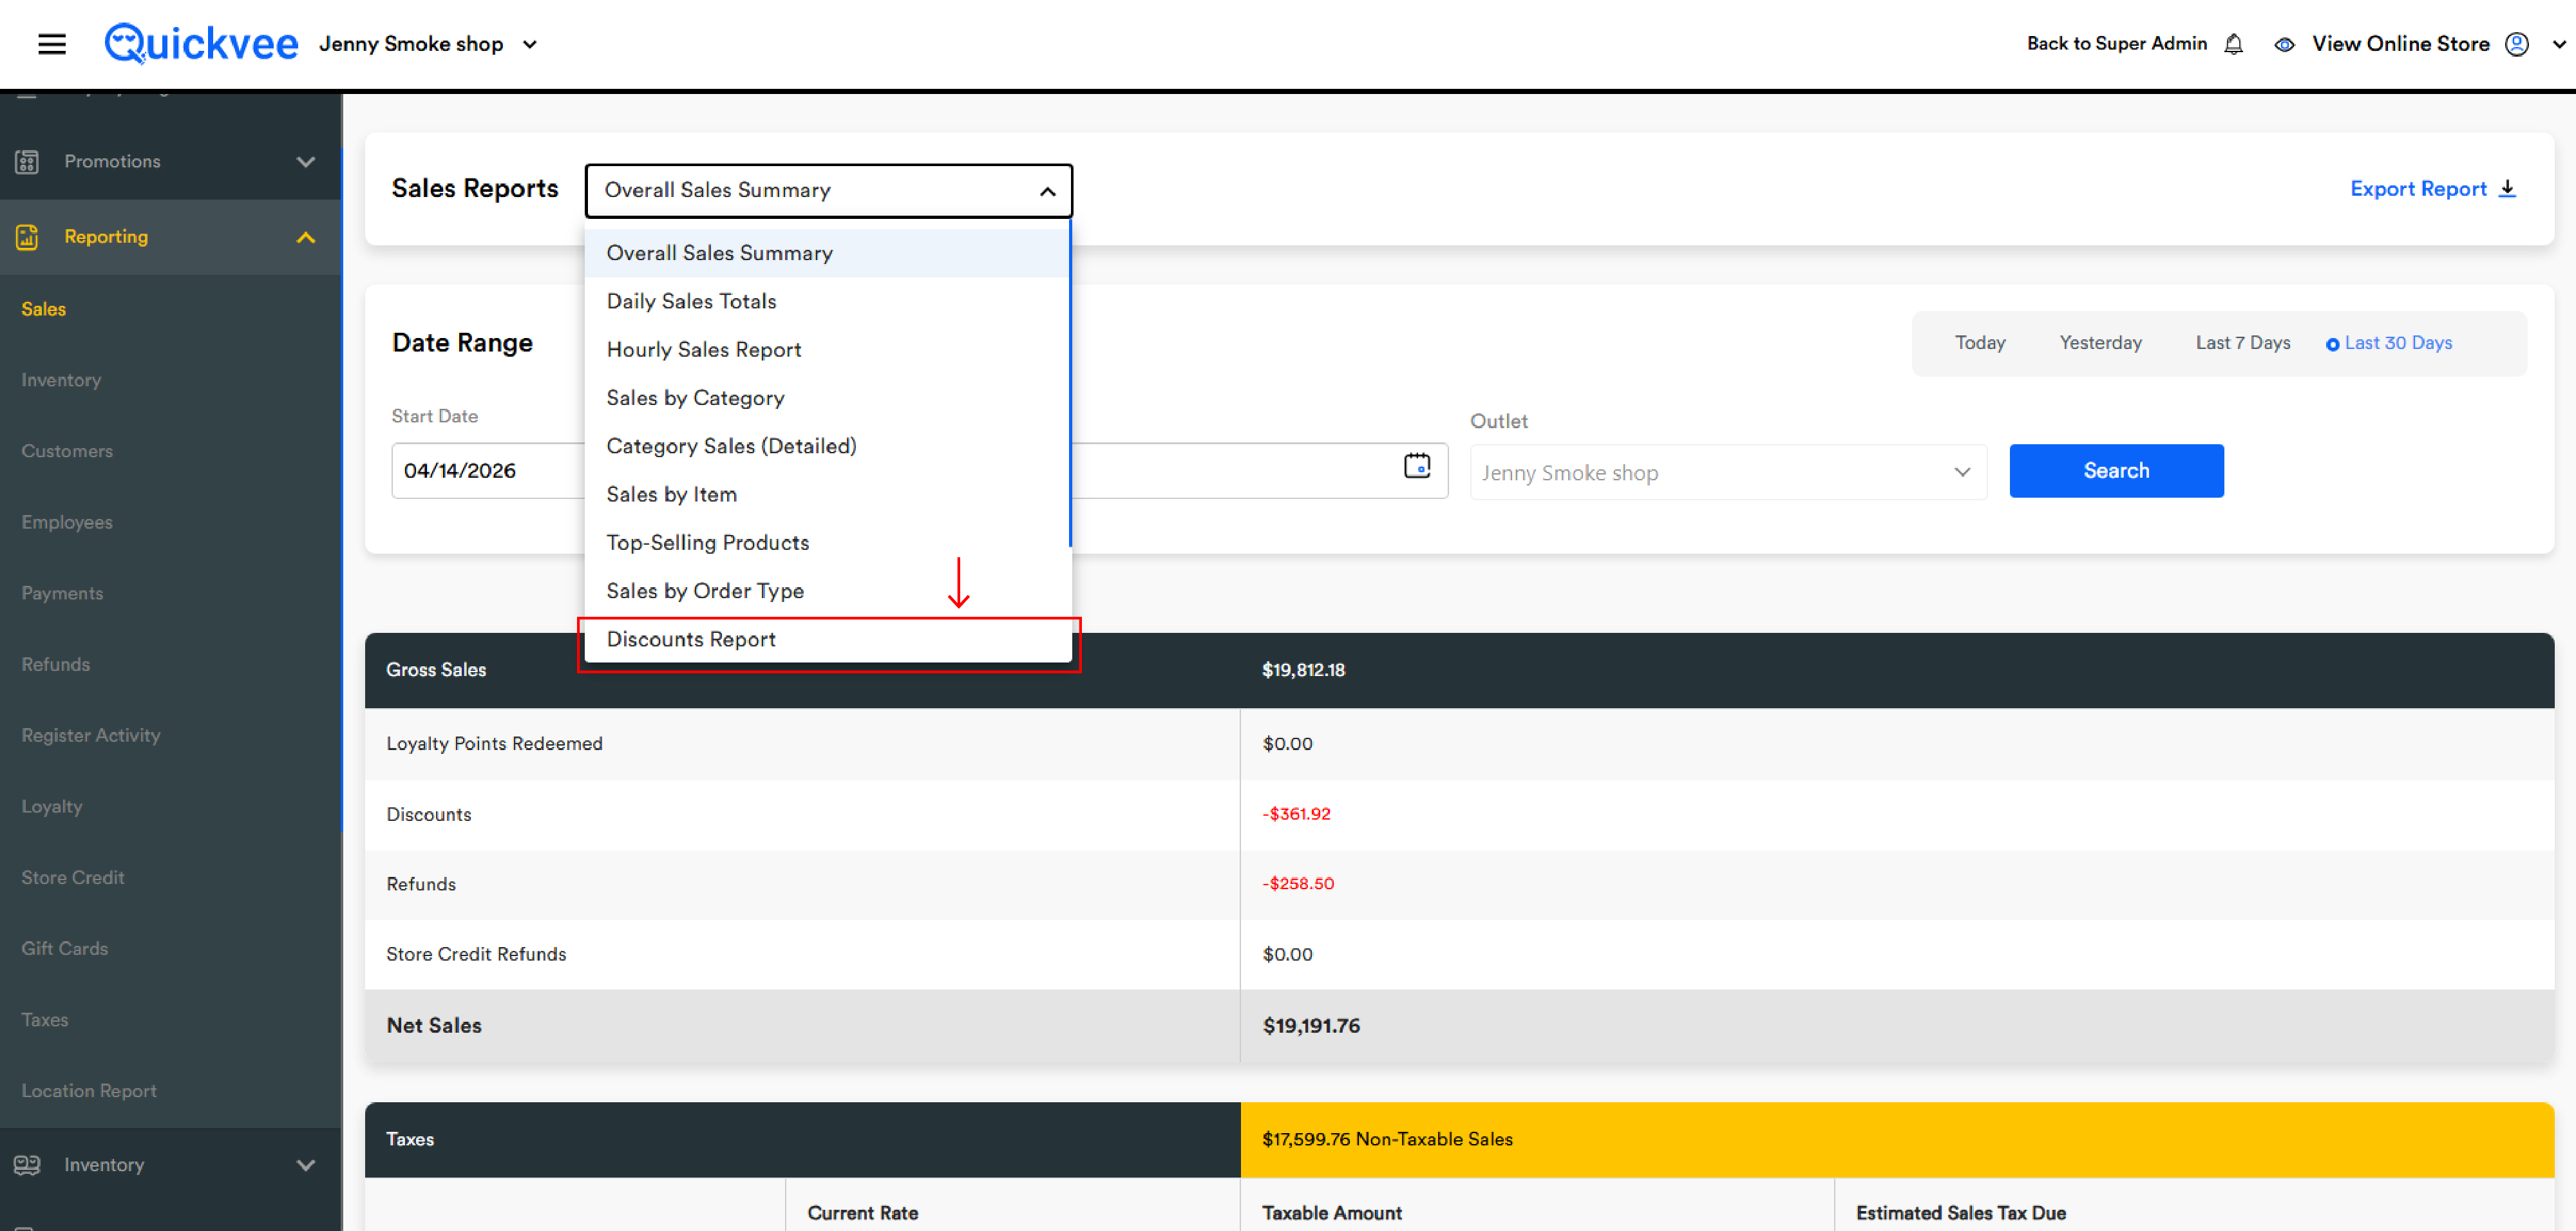
Use it to evaluate whether a promo is paying for itself, to spot which staff or stores are leaning hardest on overrides, and to reconcile discount totals against the dashboard.
The filter bar
Report selector
The Sales Reports dropdown at the top of the page lets the merchant switch between Discounts Report and other sales reports.
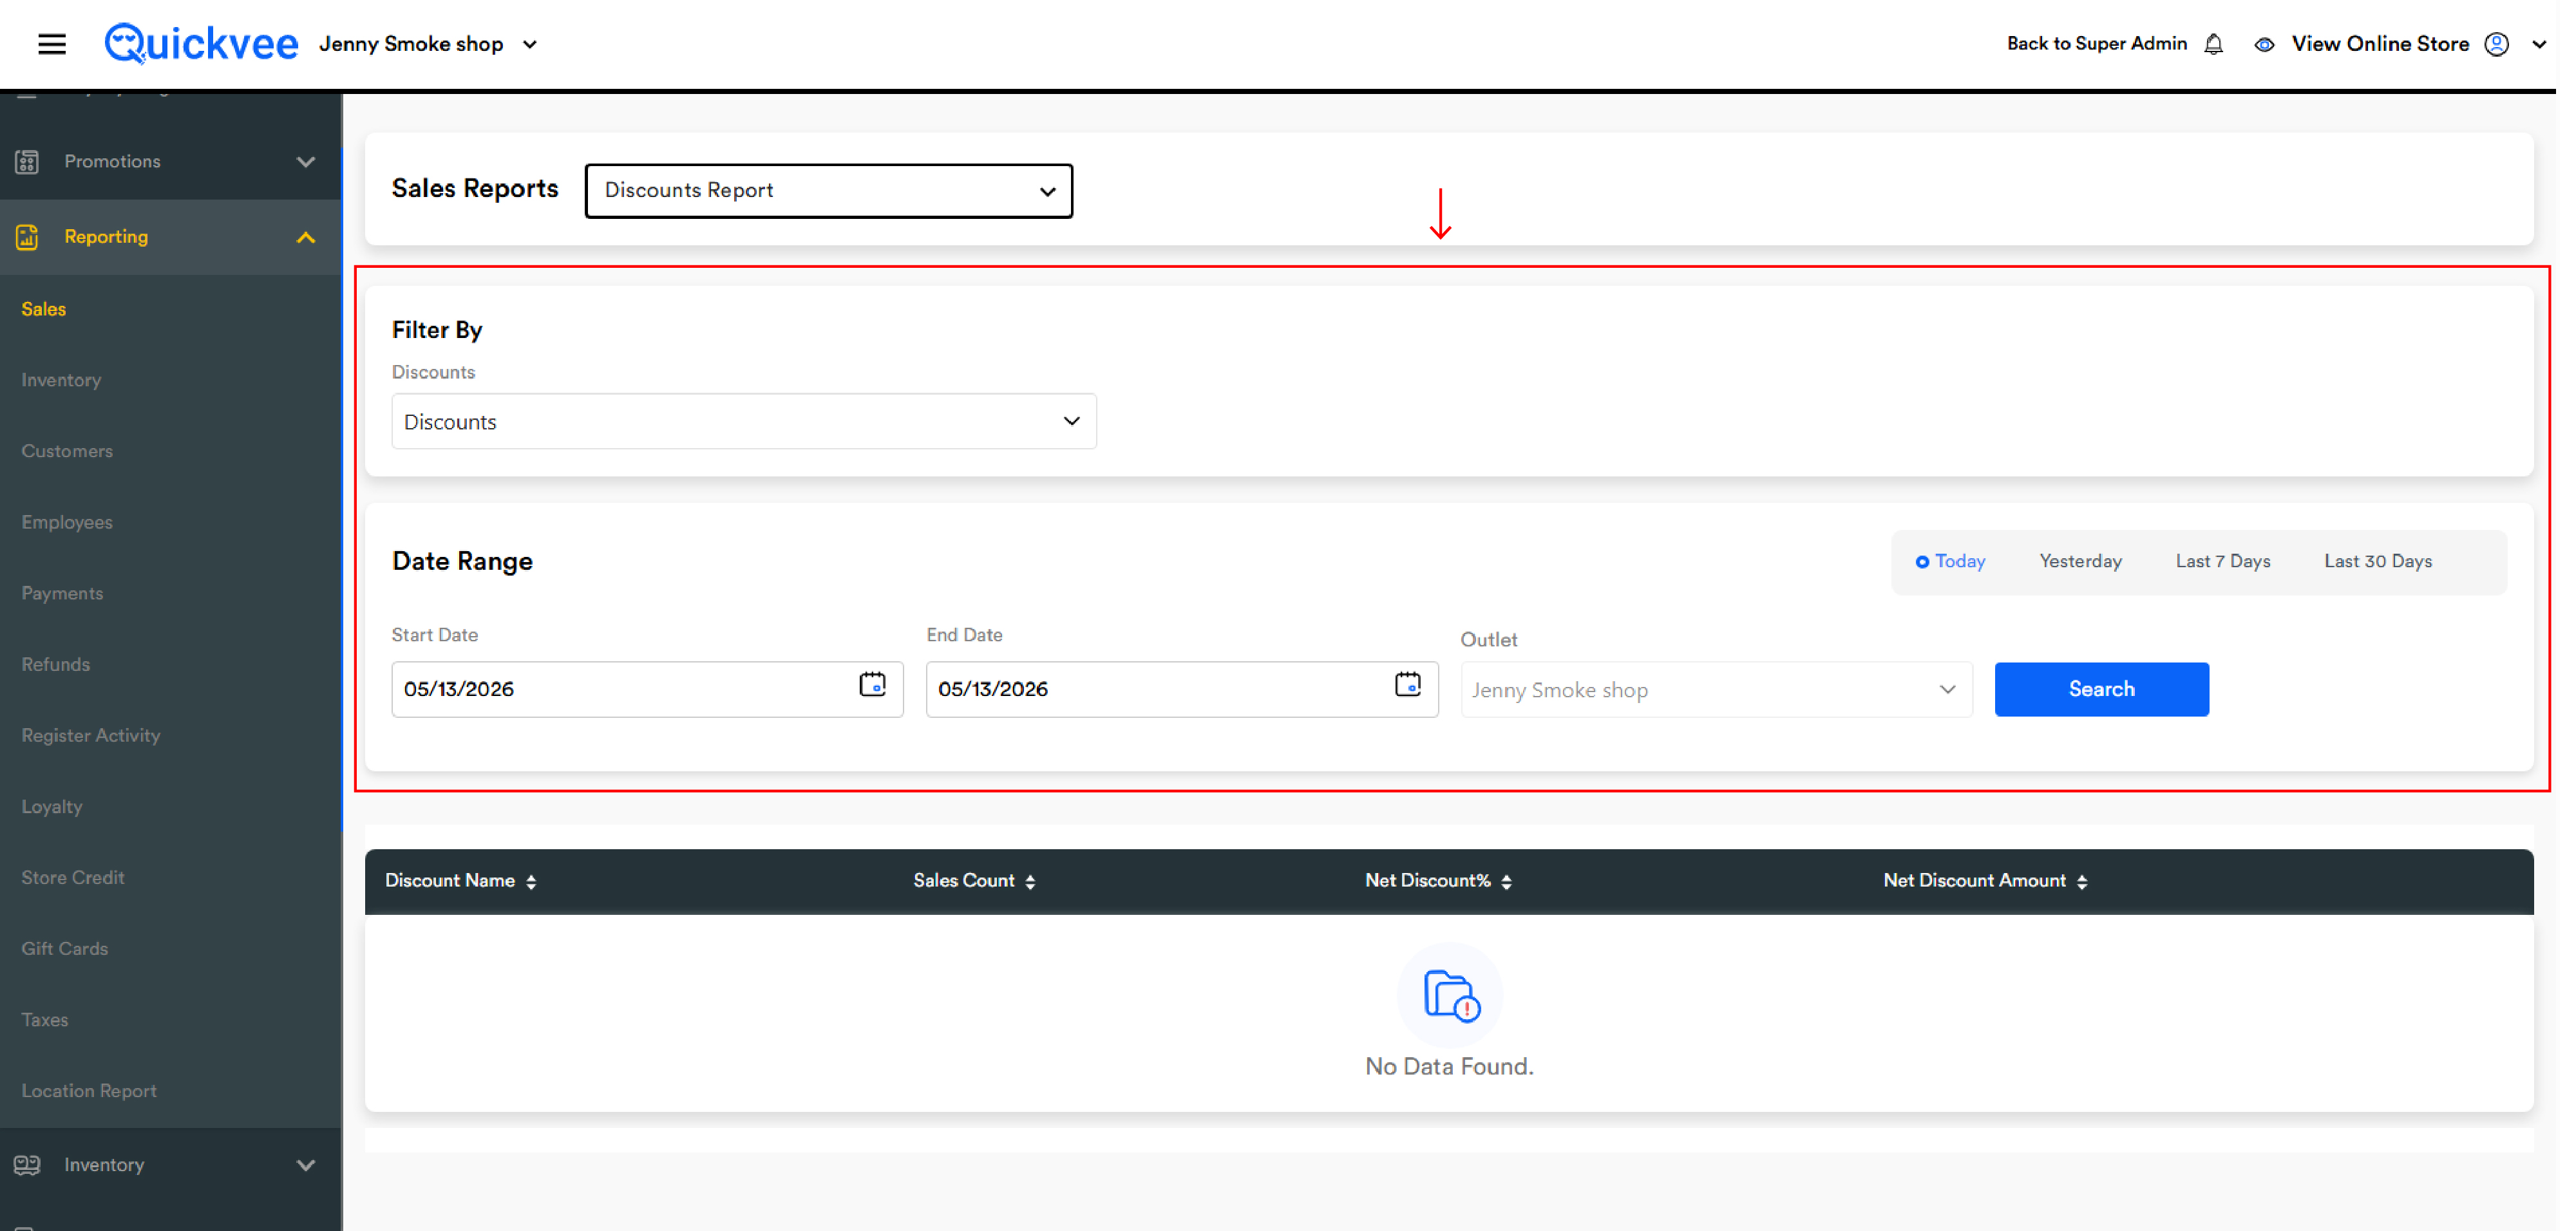
Filter By — Discounts
|
Discount Type |
What it captures |
|---|---|
|
Custom Discounts |
Cashier-applied ad hoc discounts at the register — both item-level and order-level percentage or fixed-amount overrides |
|
Loyalty Points Discounts |
Reductions from customers redeeming loyalty points at checkout |
|
Mix N' Match Discounts |
Bundle-style promotions where buying qualifying items unlocks a combined discount |
|
Coupon |
Code-based or pre-defined coupons applied at checkout |
|
BOGO Discount |
"Buy one get one" promotions where a qualifying second item is free or discounted |
Leaving the filter on Discounts (the default, all selected) shows every type — recommended for a full picture.
Date range
-
Quick filters — Today, Yesterday, Last 7 Days, Last 30 Days
-
Manual — Start Date / End Date pickers
Outlet
For multi-store accounts, the Outlet dropdown selects which location.
Search & Export
-
Search — applies filters and reloads the charts and table
-
Export Report — downloads the filtered view
Reading the charts
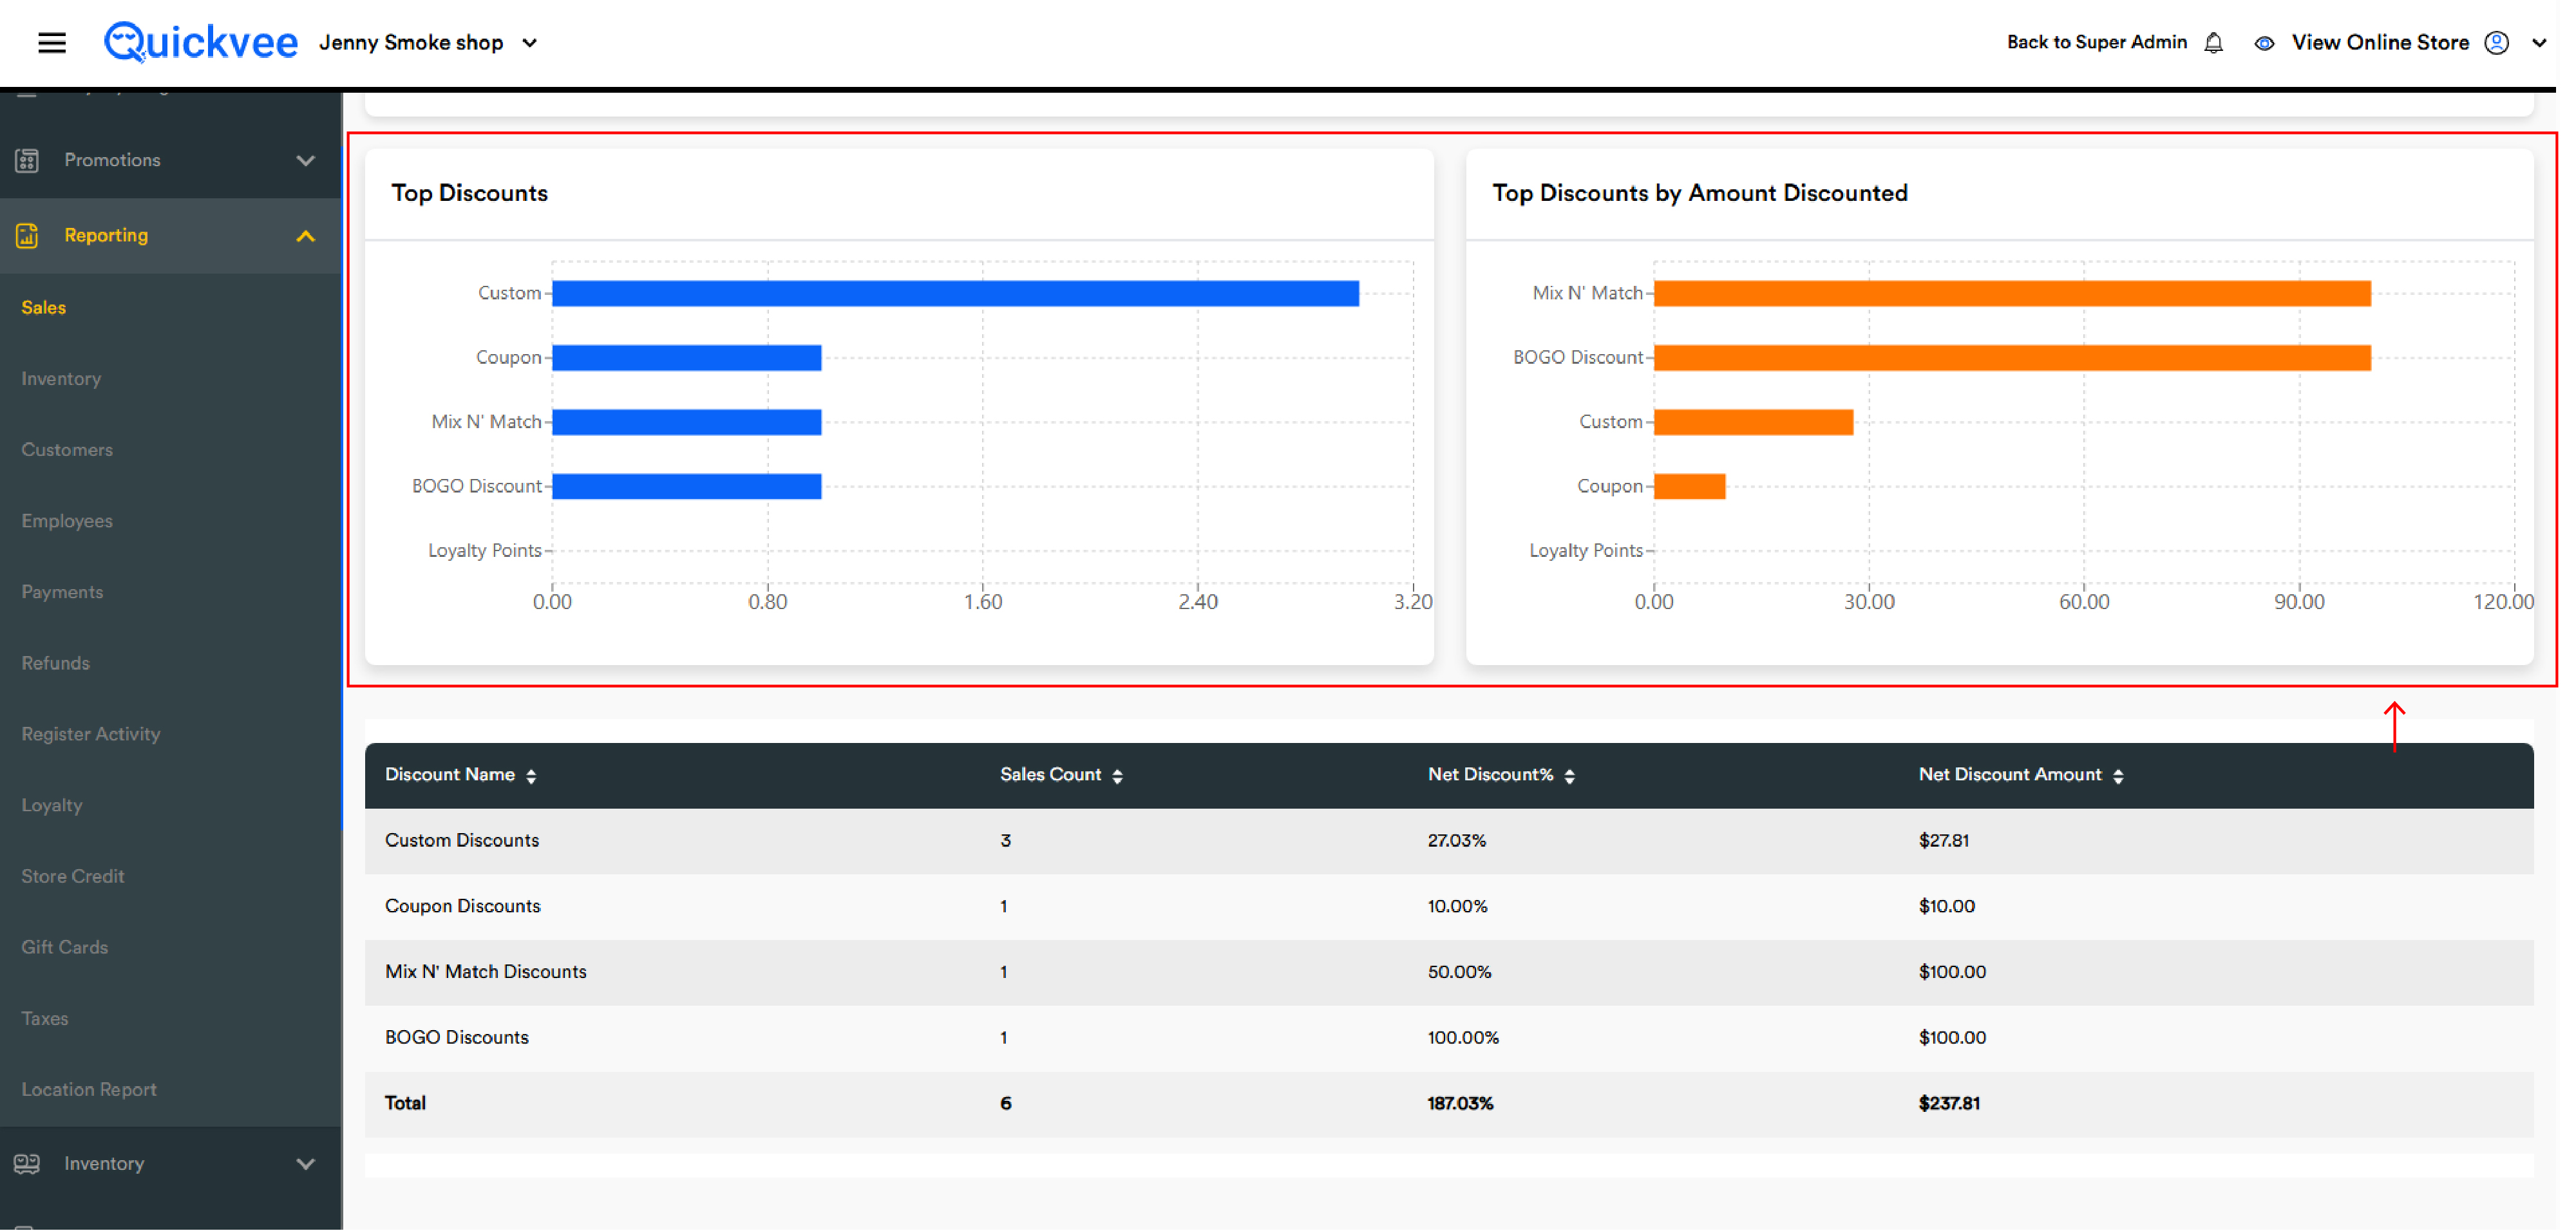
Top Discounts (by count)
Counts how many separate sales used each discount type during the range. A discount type used on 48 different orders shows a bar of 48. Answers: "Which of my promos do customers actually use most often?"
Loyalty Points often dominates by frequency — customers redeem points often even when the dollar value of each redemption is small.
Top Discounts by Amount Discounted
Sums the actual dollar value taken off across all orders for each discount type. Answers: "Which of my promos costs me the most money?"
The two views often disagree, and that disagreement is the insight — a discount type can be applied frequently but cost very little (low-value redemptions), or applied rarely but cost a lot per use (high-value bundles or large overrides).
Reading the detail table
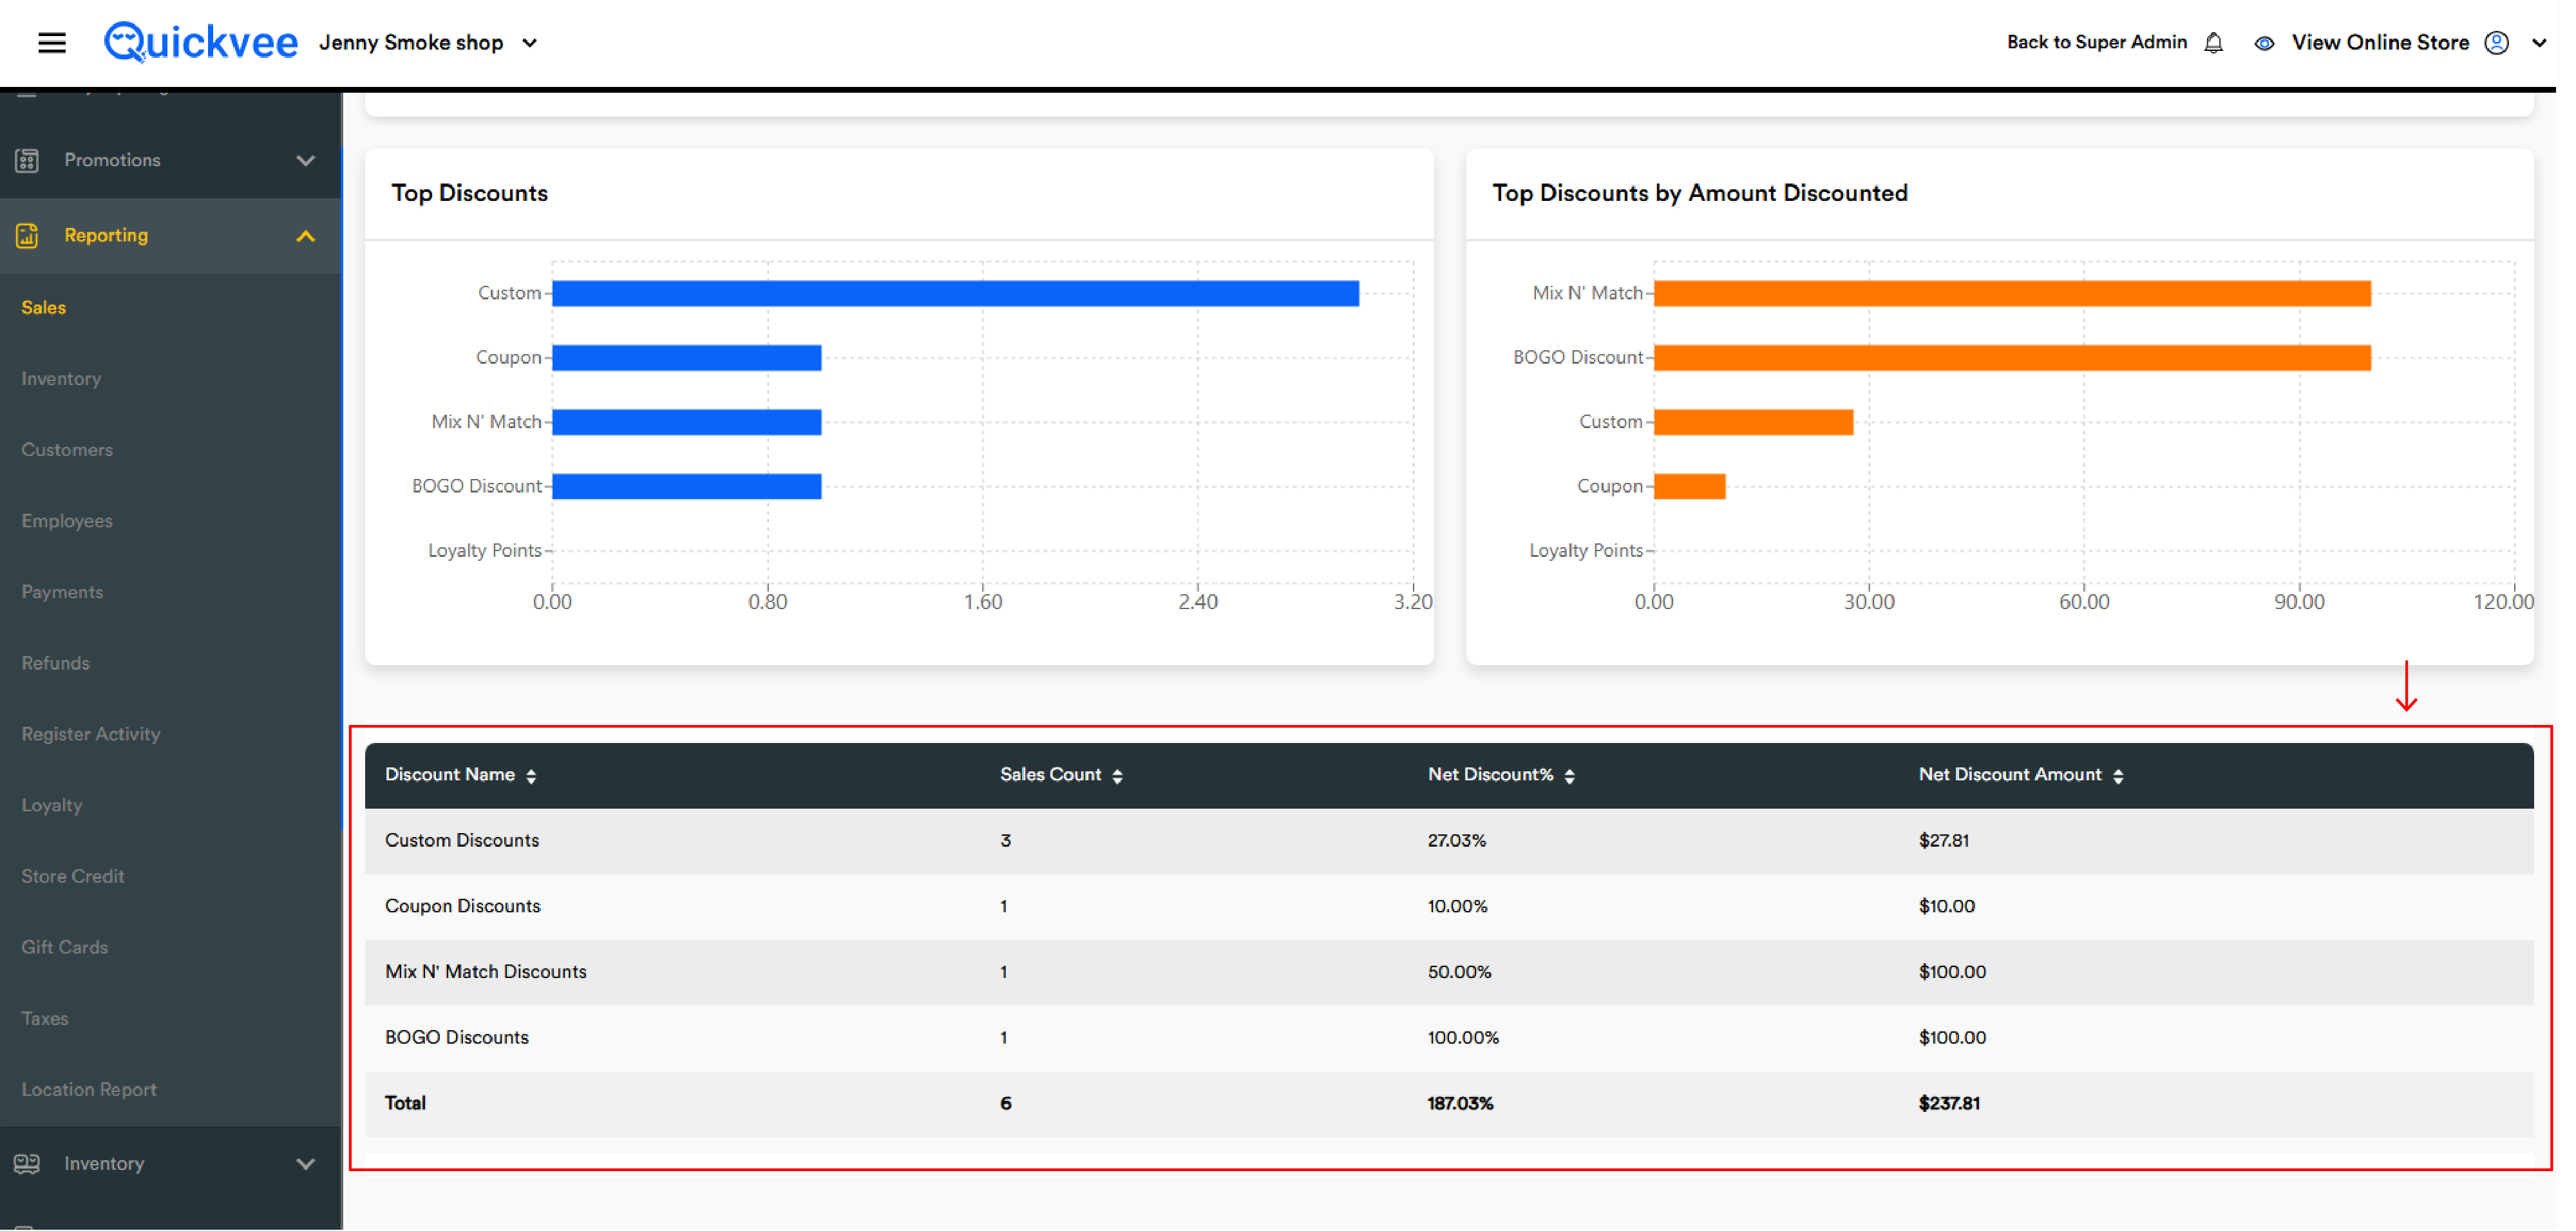
|
Column |
What it shows |
|---|---|
|
Discount Name |
The discount type. One row per type that recorded activity. Types with zero activity are omitted from the table but shown in the charts |
|
Sales Count |
Number of separate sales where this discount type was applied. A single sale with two different discount types is counted once for each |
|
Net Discount % |
Share of that discount type's contribution against gross sales for the period |
|
Net Discount Amount |
Total dollars taken off across every sale where this discount type was applied |
Total row
The bottom row sums every column:
-
Total Sales Count — every discount application across all types (a single sale with two different discounts contributes 2 to this total)
-
Total Net Discount % — combined discount percentage across all types
-
Total Net Discount Amount — every dollar of discount given — the bottom-line "cost of promotions" for the range
Common workflows
"How much did I give away in promotions yesterday?"
Quick filter → Yesterday → Search. Read the Total row, Net Discount Amount column.
"Are loyalty redemptions worth it?"
Quick filter → Last 30 Days → Search. Compare the Loyalty Points row's Sales Count (engagement) against its Net Discount Amount (cost). High count + low amount = customers love the program without hurting margins. Low count + high amount = the program is being gamed by a few high-value redemptions.
"Which store discounts hardest?"
Run the report once per outlet for the same date range. The outlet with the highest Total Net Discount % is the most aggressive on promotions relative to gross sales.
"Which promotion type is most efficient?"
Compare the two charts side by side. Tall count bar + short amount bar = used often without giving away much — that's the most efficient. The reverse = a few high-value redemptions doing most of the damage.
"Reconcile a daily total"
Use the same date range as the dashboard or Daily Sales Totals. The Total Net Discount Amount should match the discount line on those reports.
Important notes
Refunded sales reduce the count and amount. A fully refunded sale reduces both the sales count and the net discount amount for that discount type.
A single sale can contribute to multiple discount types. If one order received both a coupon and a Mix N' Match discount, that order is counted in both rows. The Total row's Sales Count therefore can exceed the actual number of unique orders — it counts discount applications, not orders.
Custom Discounts cover both item-level and order-level overrides. A cashier marking down a single product and a cashier marking down the entire order both land in Custom Discounts. To see who applied them, use the Discount Per Employee Report.
Order Type Discount (OTD) is included. OTD discounts (applied automatically based on order type — pickup, delivery, etc.) flow into the report under their configured discount category.
The percentage column is share of gross sales, not the discount rate. A row showing 21.40% does not mean that discount averaged 21.40% off — it means that discount type accounted for 21.40% of gross sales worth of reductions across the range.
Filters do not auto-apply. Changing a date or a discount filter requires tapping Search.
Discount types with zero activity still appear in the charts — empty bars confirm the report is checking for them, not that the report missed them. They simply weren't used.
Calculation reference
|
Field |
Formula |
|---|---|
|
Total Discount Amount |
|
|
Net Discount % |
|
|
Custom row |
Orders with custom/manual/adjust price discounts |
|
Coupon row |
Orders with coupon discounts excluding OTD |
|
Loyalty Points row |
Orders with LP discount |
|
Mix N Match row |
Orders with mix-match discount |
|
BOGO row |
Orders with BOGO discount |
Mix-Match values are stored as negative in the DB, so ABS() is used. Only paid orders are included. A distinct order count is used to avoid duplicate counting.